

From data-blind to insight-led confidence
Juni swapped out MetaBase to go metrics-first with Steep, giving all teams easy access to reliable data, cutting data requests by 70%, and transforming the data team into strategic advisors.
Mustii El-Noaimi leads the data team at Juni, responsible for the entire data ecosystem. His agile team runs data engineering, data science, and analytics expertise with the core mission to enable Juni to make faster, smarter, and more confident decisions by leveraging data efficiently.
“Users were data-blind. Not because we didn't have the data, but because they couldn't access or trust it.”
About Juni
Juni provides SMEs with modern business banking, spend management, accounting, and financing, on one powerful platform and app.
- Industry: Business Banking
- Size: 130+ employees
- Headquarters: Stockholm
- Visit: juni.co
Background Dependency on the data team
Before adopting Steep, Juni used MetaBase as its BI tool. Each data request was directed to the data team, who spent significant time understanding the use cases before delivering data in spreadsheets and dashboards, and answering follow-up questions.
“Previously, we spent a lot of time understanding use cases and constantly building and tweaking dashboards. For every use case, we got a minimum of five follow-ups.”
Challenges Analysts stuck in a reactive loop
Before Steep, Juni struggled with dashboard overload. Business users didn't know which data to trust, and because they couldn't access data independently, even the simplest requests added ad hoc work for the data team, creating a major bottleneck for insights.
Main Challenges:
- High dependency on the data team: Every request and follow-up required an analyst's attention. It slowed down decision-making and turned the data team into a reactive, dashboard-building service, preventing them from focusing on strategic, high-impact work.
- The SQL barrier: The previous setup worked well for technical users, but it was a struggle for those lacking SQL skills. Business teams couldn't explore or feel confident in the data, even though the data team poured effort into making it accessible and structured.
- Maintenance of self-hosted tools: Because the solution was self-hosted, it required engineers to manage hosting and patching. Even though the software was free, the maintenance added complexity and cost.
“The unnecessary dependency on the data team slowed down Juni's momentum. My team was stuck acting as a dashboard-building service.”
Solution Balancing user freedom with governance
There was a clear vision to empower the entire organization with a metric-based and user-friendly BI tool that anyone could use independently, regardless of technical skills.
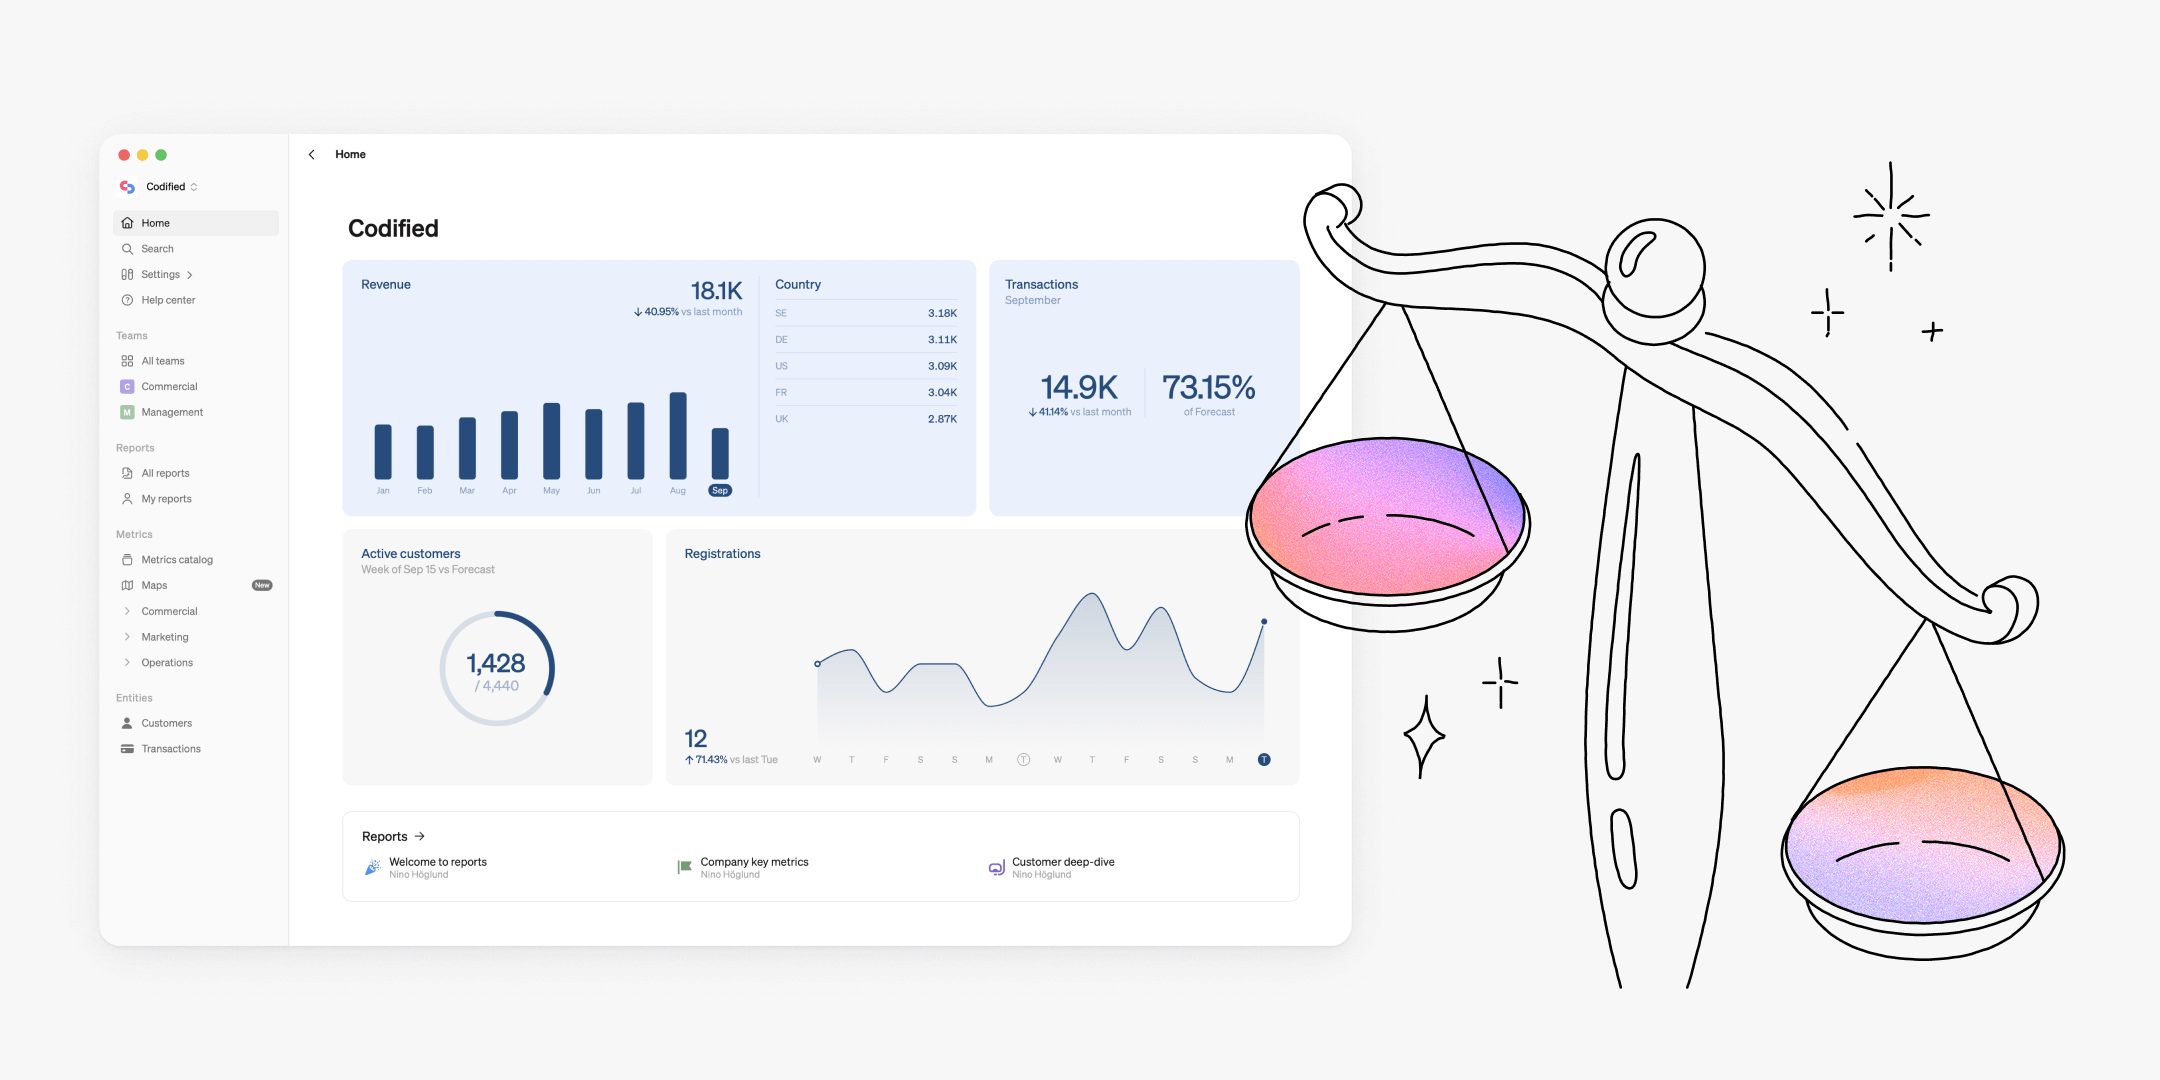
The centrally defined and governed metrics catalog in Steep allows users to easily find metrics, understand their business definitions, and see ownership, while giving the data team full control. This solved one of Juni's central challenges of balancing user freedom with data governance.
“Steep hits the perfect balance between power and usability.”
Using Steep Confidence in data
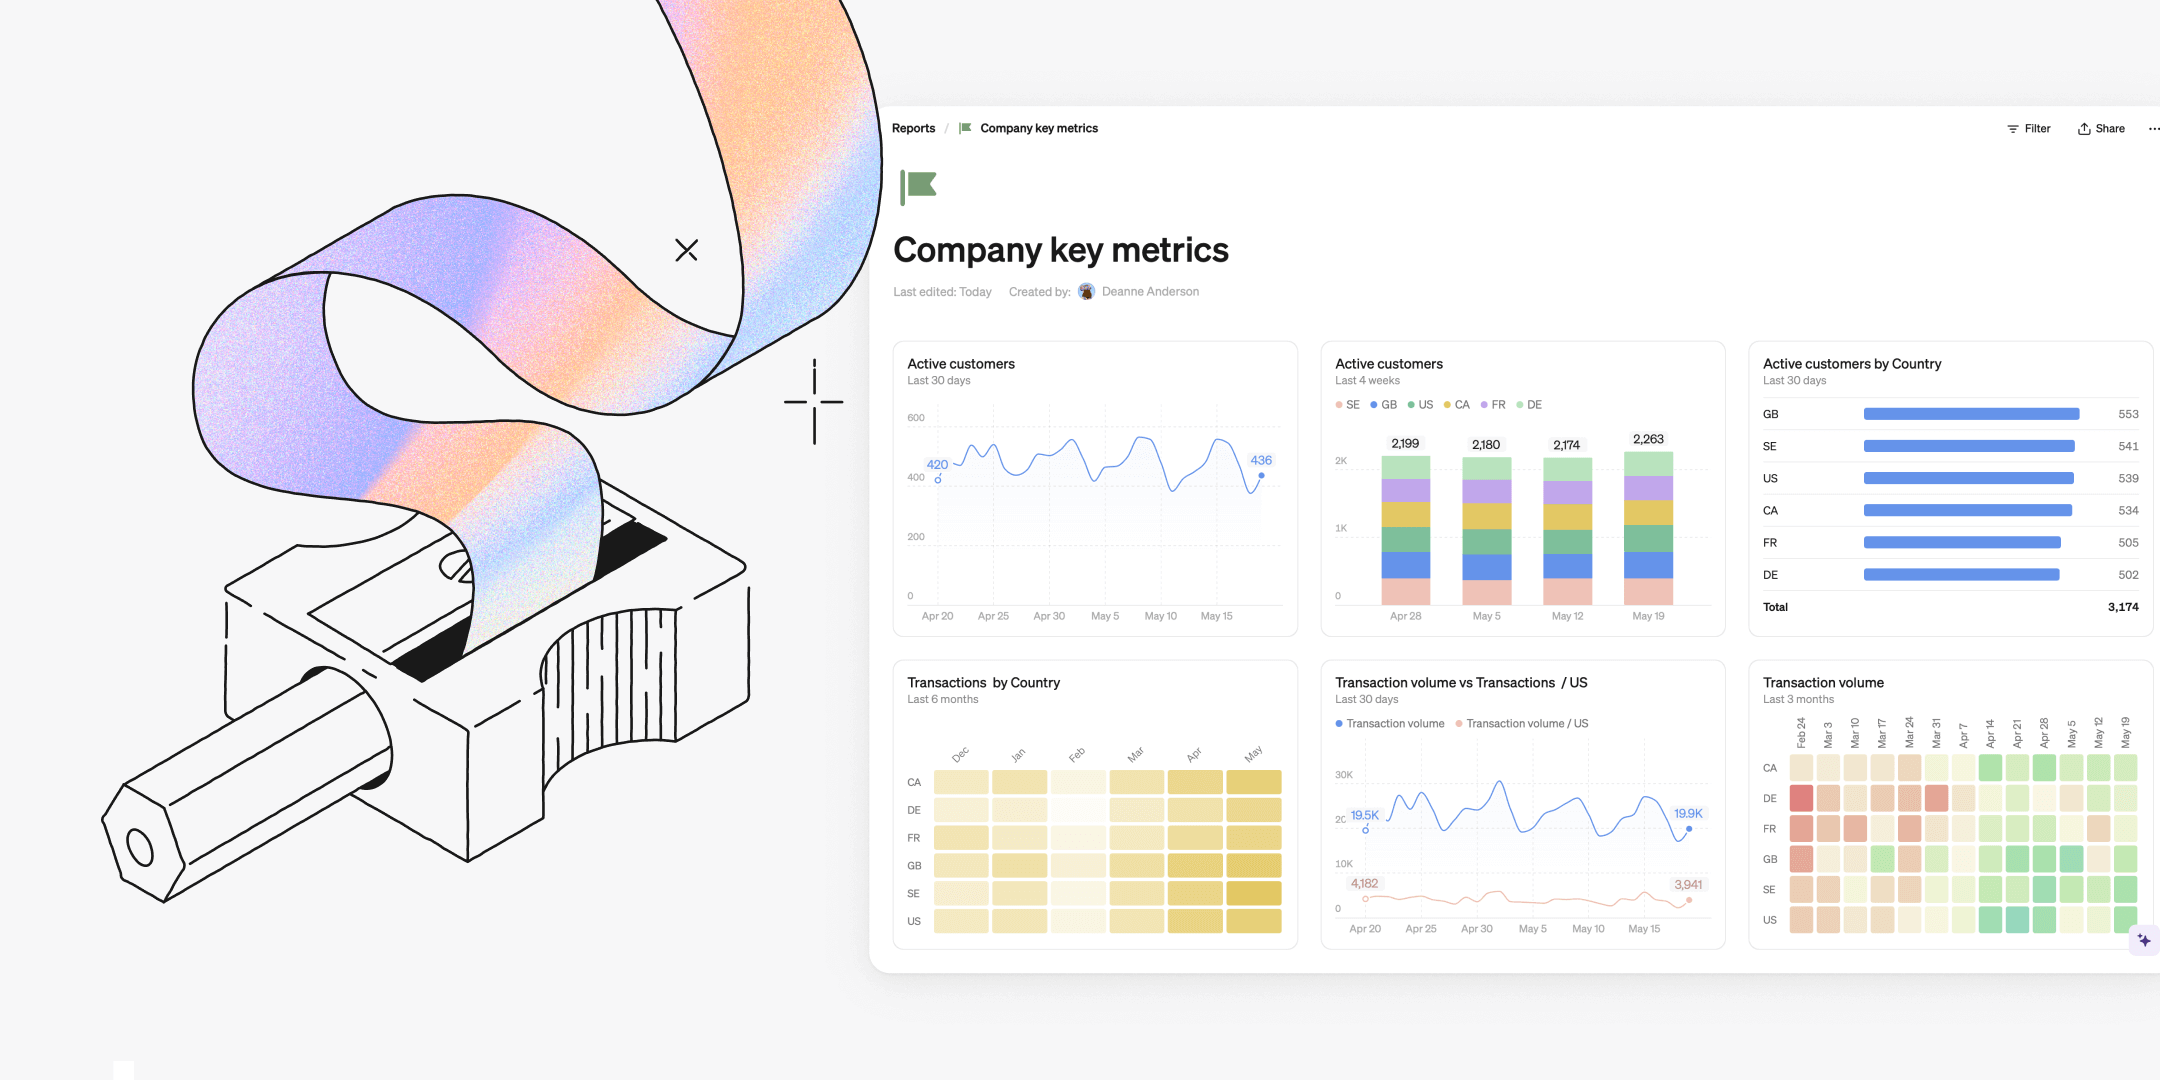
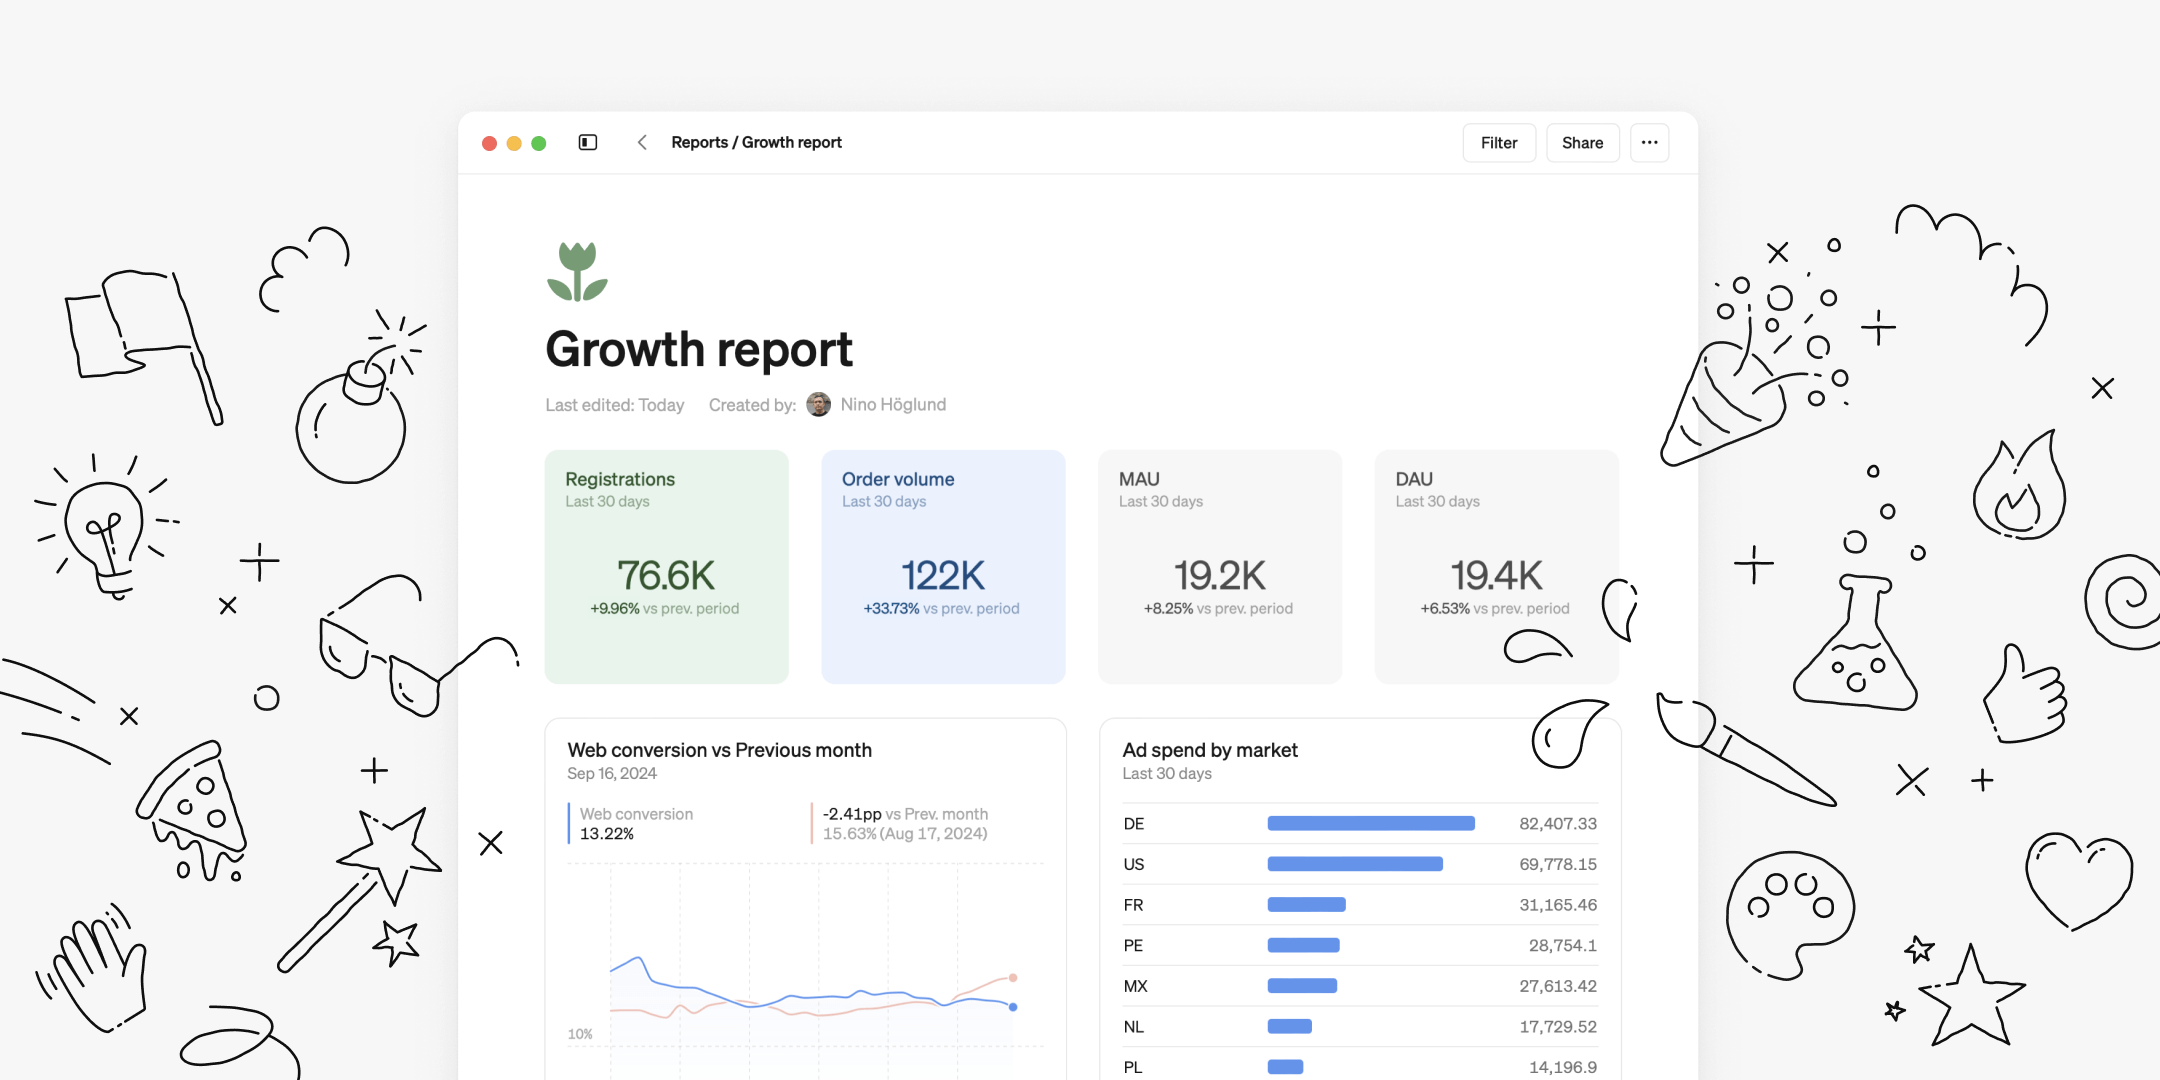
Juni uses Steep for all company-wide analytics and performance monitoring, replacing the dashboard overload of the past with metrics from a single source of truth. All teams can now access the same numbers in an easy-to-use interface, creating a consistent and reliable foundation for data-driven decisions.
Steep enables:
- Company-wide access: All teams have access to metrics in Steep to monitor KPIs and share insights.
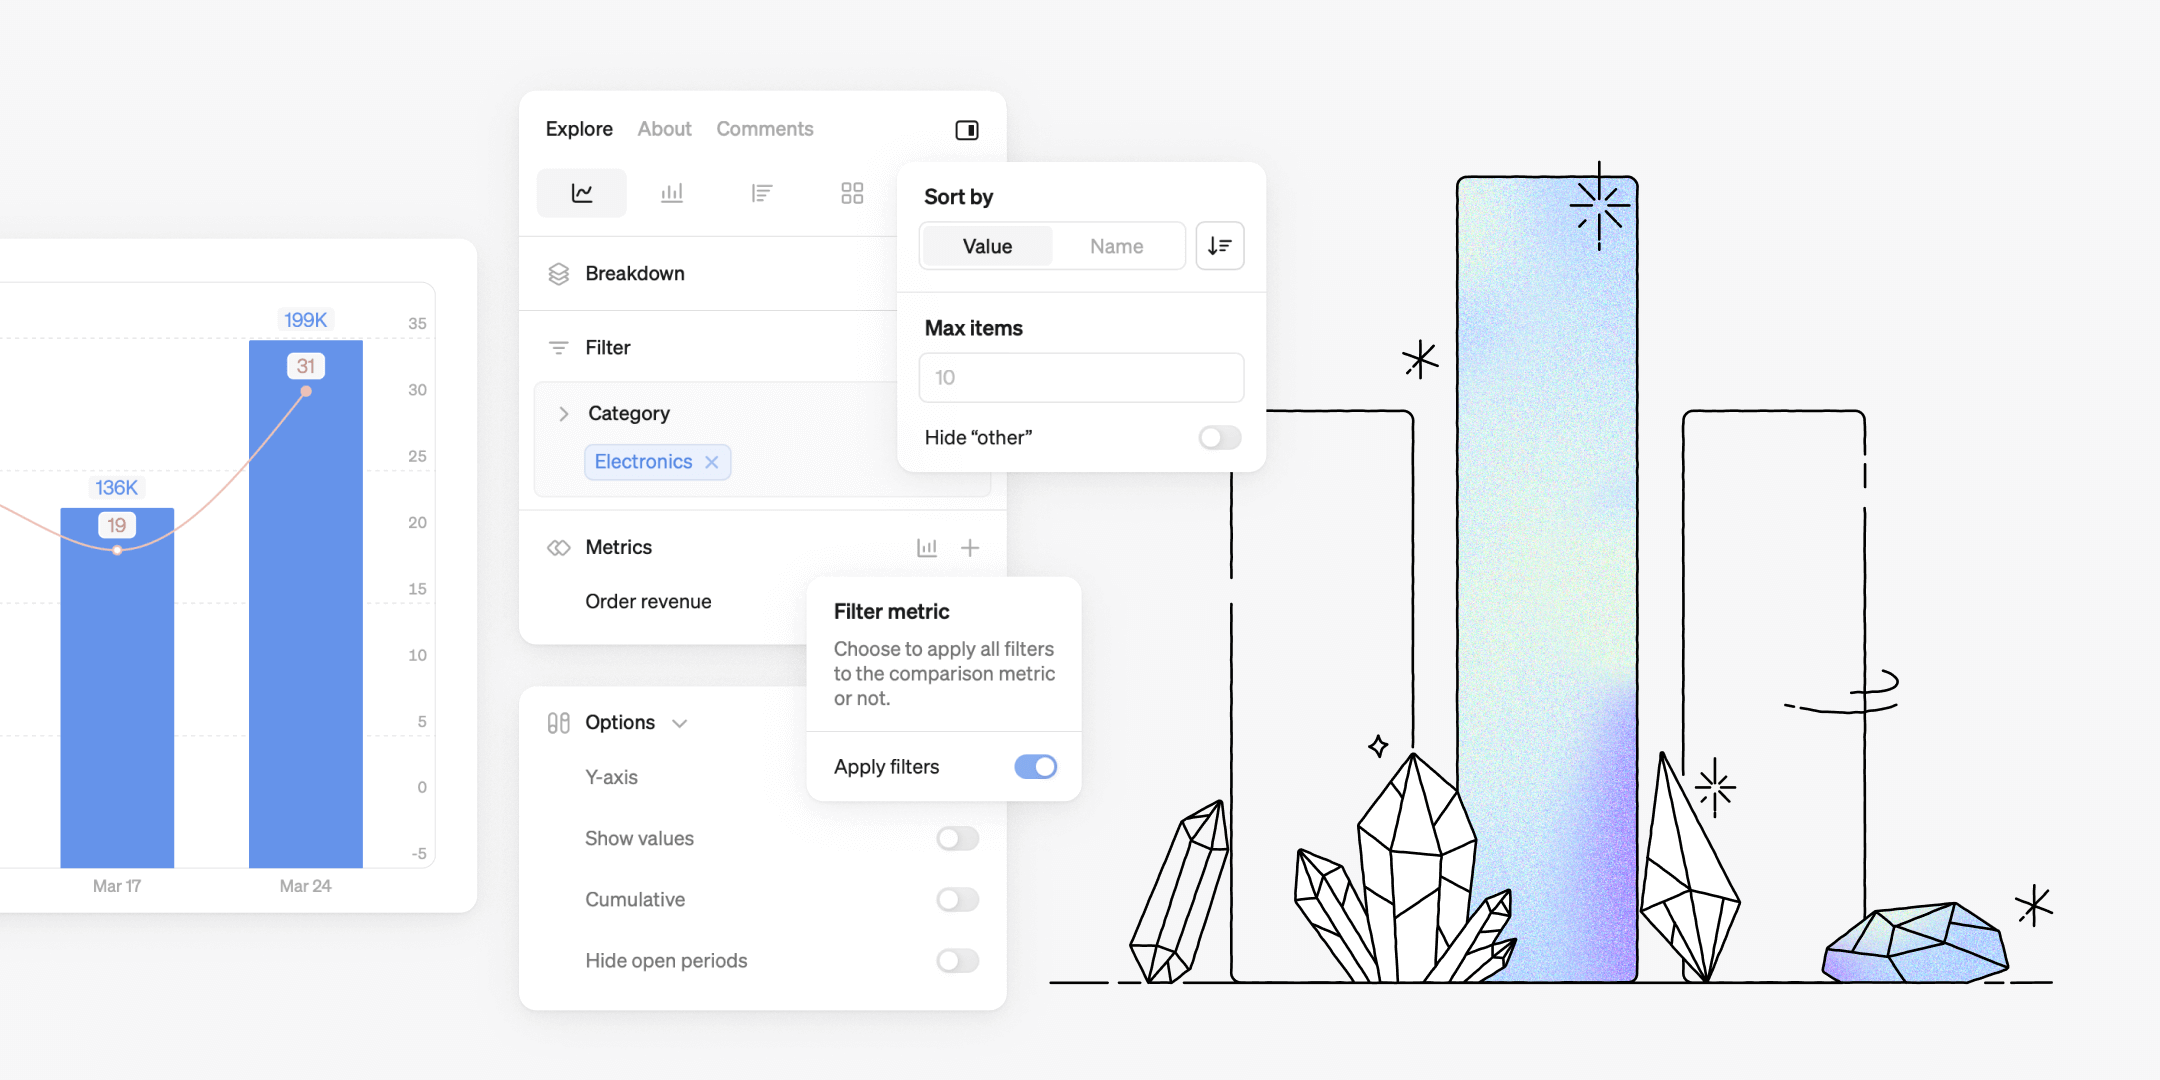
- Independent exploration: Users can segment, drill down, and compare metrics independently, and create their own reports to follow key KPIs and team-specific OKRs.
- Self-service insights: Steep empowers everyone to answer their own data questions, minimizing the request load and ad-hoc work for the data team.
“Users can create their own reports with confidence, without feeling that they are breaking anything. The feedback from the majority is: 'I love it.'”
How Juni's teams use Steep
- Each team uses its own team space to monitor and report on relevant OKRs.
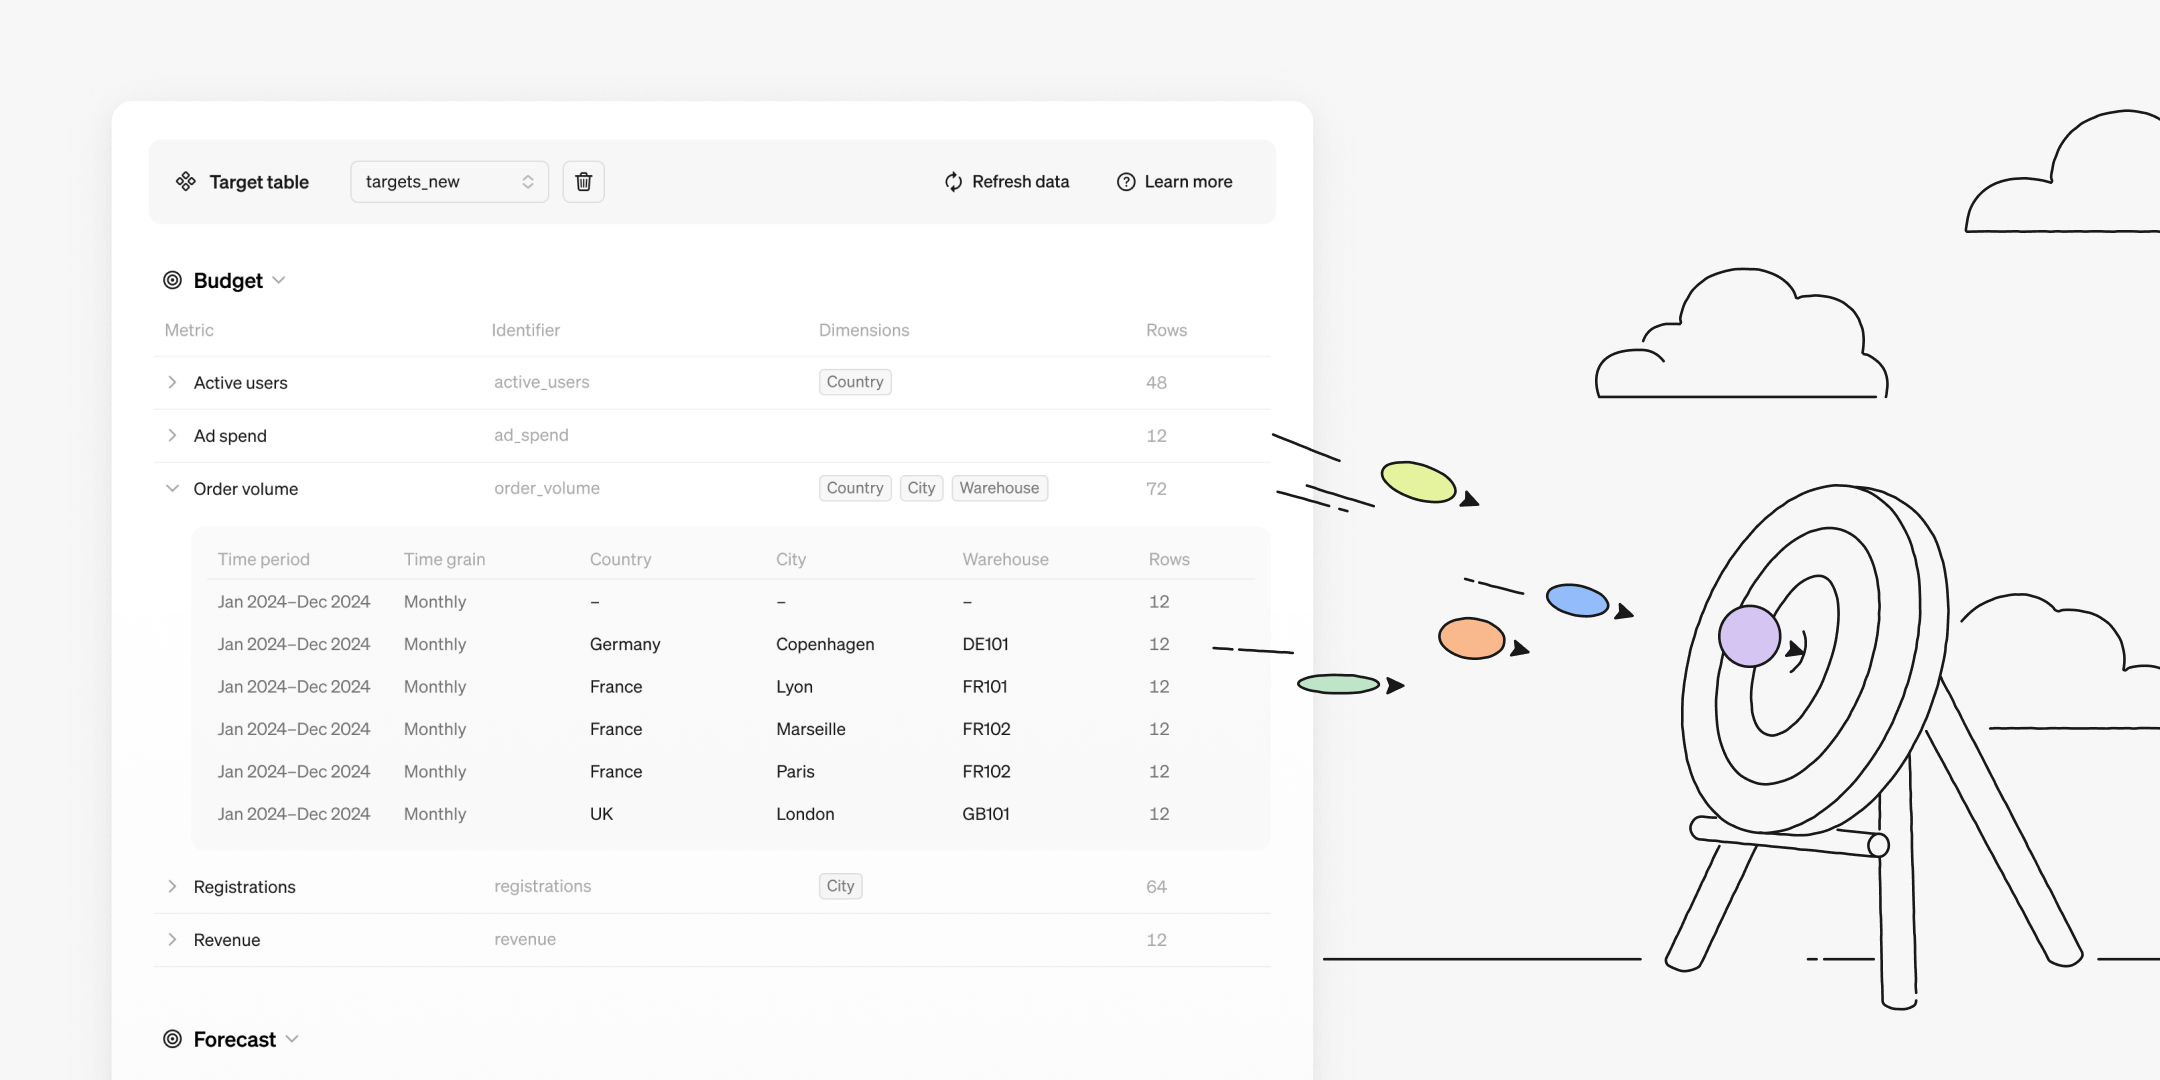
- The product team tracks targets and OKR performance and uses insights to improve the product.
- Executive Leadership reviews performance numbers in Steep and shares them daily to the company to keep the employees informed.
- Finance and business leadership use cohort analyses in Steep to easily understand historical performance for metrics, such as revenue and payment volume at a glance.
- Commercial teams use entities in Steep to drill down and download segmented customer lists.
- Engineering tracks bug reports from Linear. They can easily filter, segment, and visualize bugs over time in Steep, breaking them down by different dimensions.
Impact The data team becomes a strategic advisor
With Steep, Juni's data team has moved from handling ad hoc requests to driving strategic business value. Freed from constant dashboard building, they now focus on higher-impact projects that enhance Juni's product and support customer-facing solutions, without growing the team.
- Strategic advisory: The data team now acts as a trusted strategic partner, supporting leadership and users with a deeper understanding of metrics and business performance.
- Long-term impact: From ad hoc requests to high-impact work that drives strategic business value. The team now has more time to work on advanced ML and AI models that power the product, generating measurable ROI.
- Scalable analytics: Steep empowers the team to expand analytics capabilities across the company without adding headcount.
“Now, the data team acts in an advisory role instead of constantly building and adjusting dashboards.”
From asking for data to understanding it
The conversations between the data team and business teams have shifted from finding data to interpreting it. Instead of asking for visualizations, where to find data, and what different definitions mean, business teams now use insights to ask smarter questions, interpret data effectively, and drive informed decisions.
- Trusted data foundation: Centralized, accurate metrics give every team confidence in their numbers.
- Insight-driven conversations: Teams align on performance, define what “good” looks like, and use insights to guide actions.
- Data in daily workflows: Metrics guide everyday operations, ensuring projects and decisions are backed by data, not gut feeling.
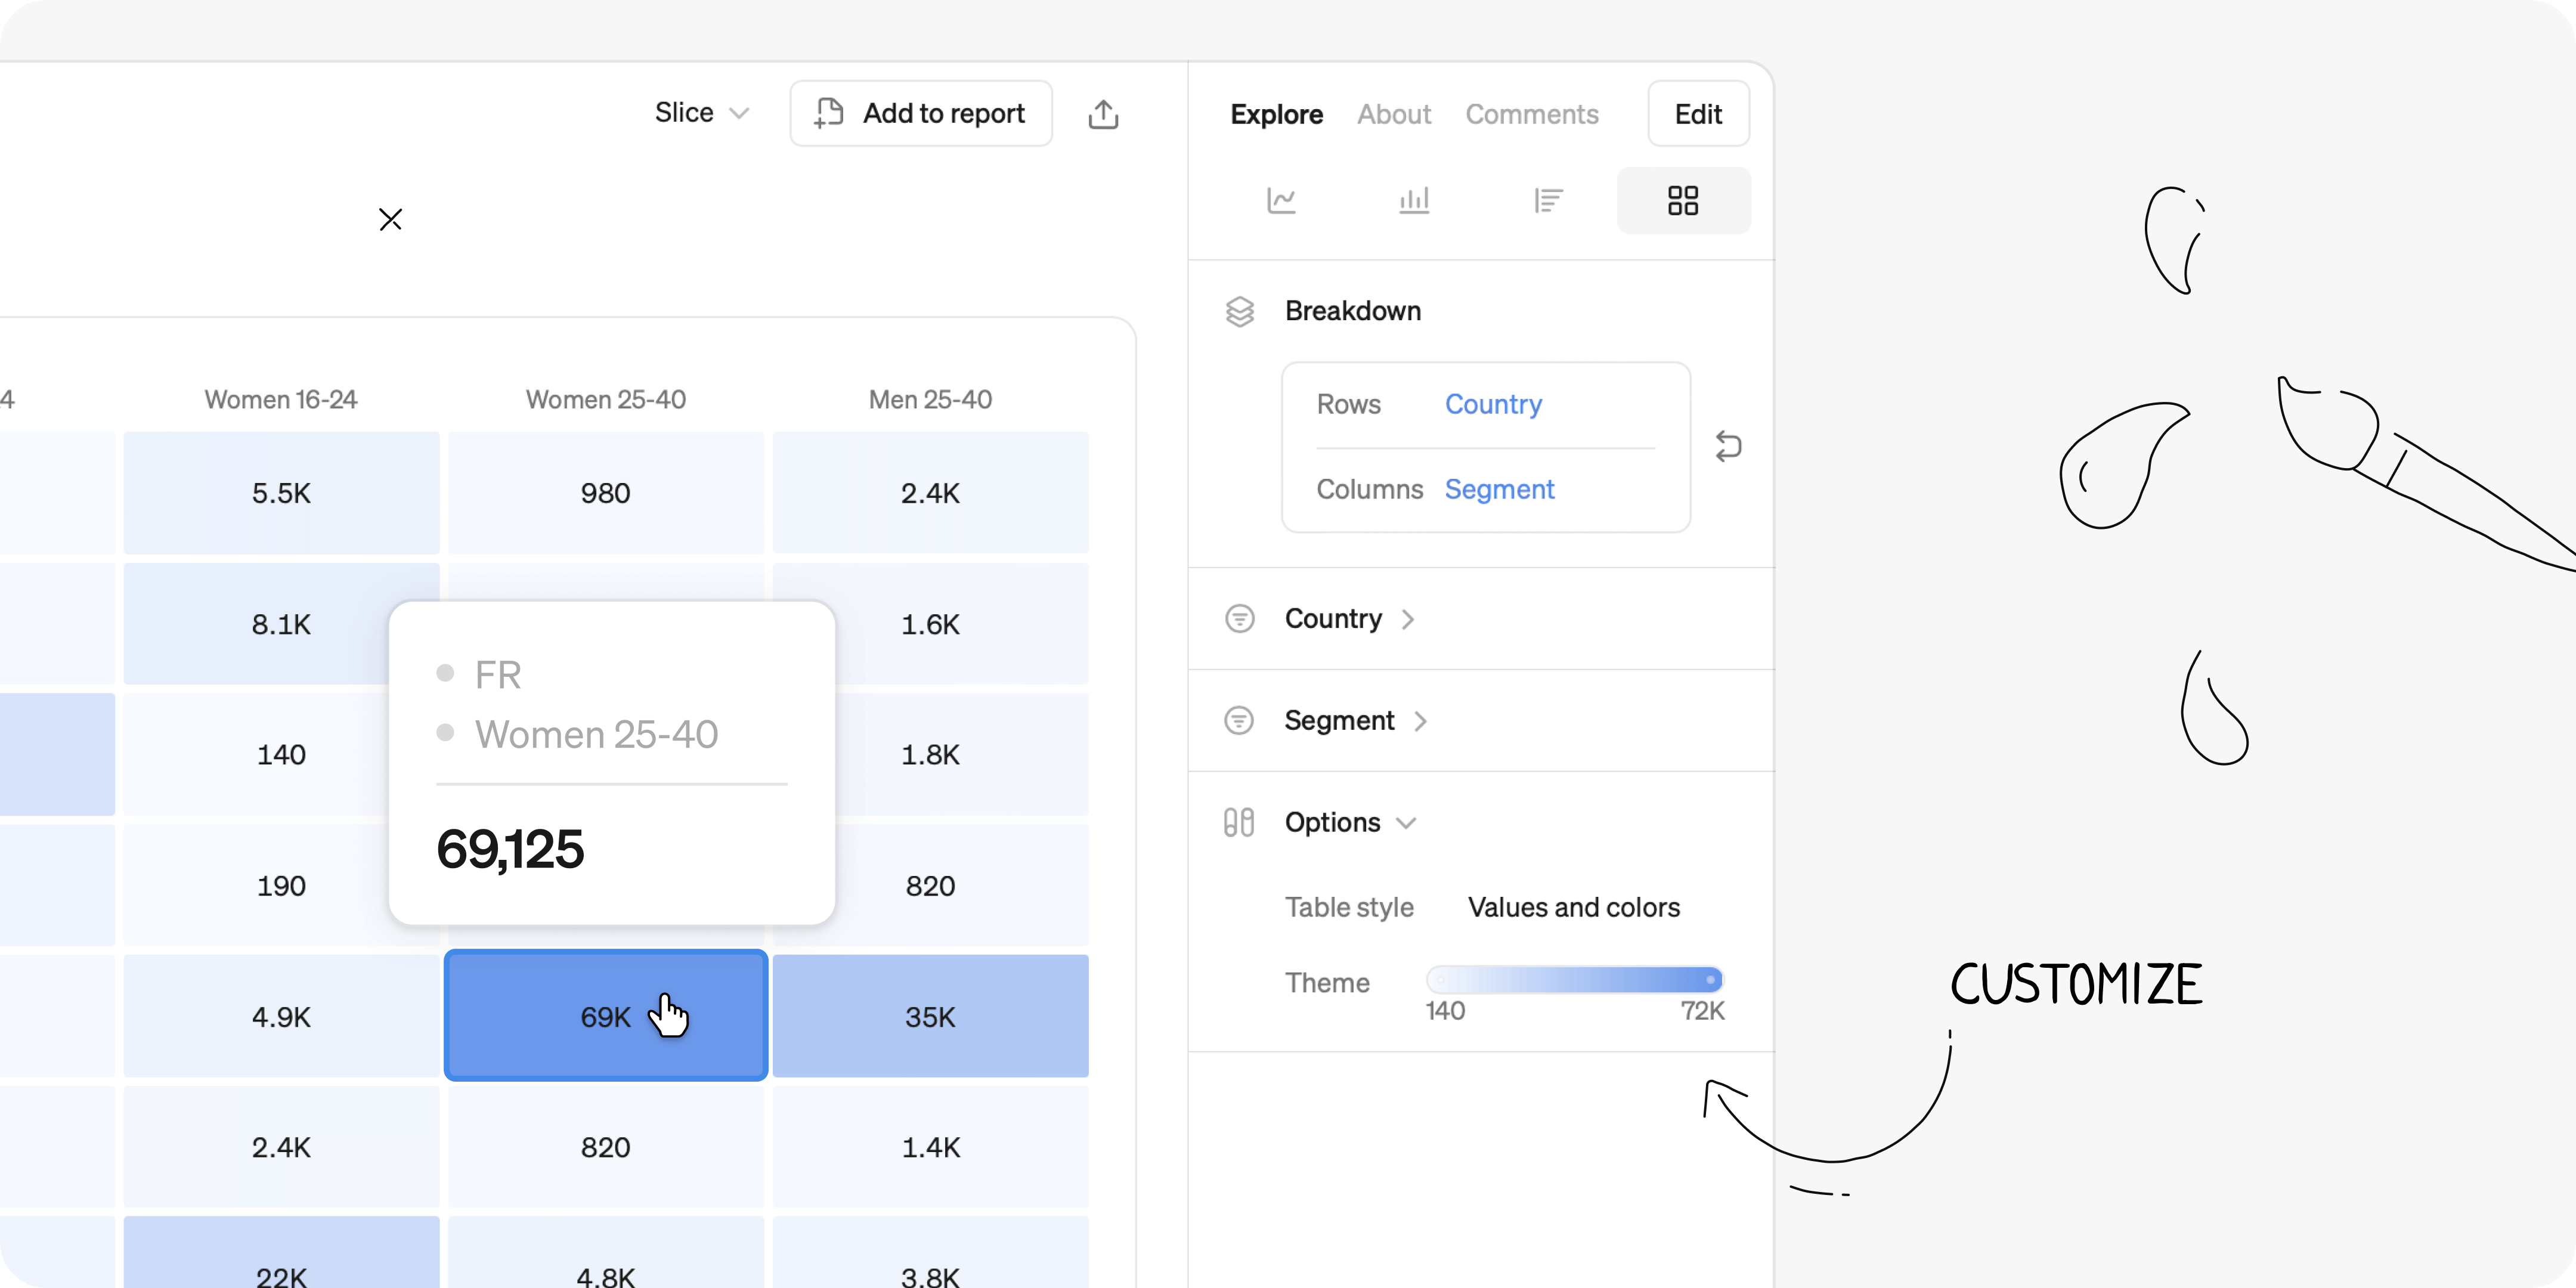
“The interface is amazing. It allows users to segment, drill down, and compare data with simple clicks. Everyone can explore while still getting the accuracy of the source.”
By replacing dashboard overload with centrally defined and governed metrics, Juni fosters a culture where everyone can access and trust data from a single source of truth. The result: faster decisions, empowered teams, and a data team that proactively drives strategy and long-term value.
Want to see Steep in action? Book a demo and discover how Steep can transform your team's analytics workflow.
More posts

A builder's guide to the Steep API
In this blog, I'll share a developer's perspective on what the new API enables, my learnings from experimenting, and some practical tips and use cases for getting started.

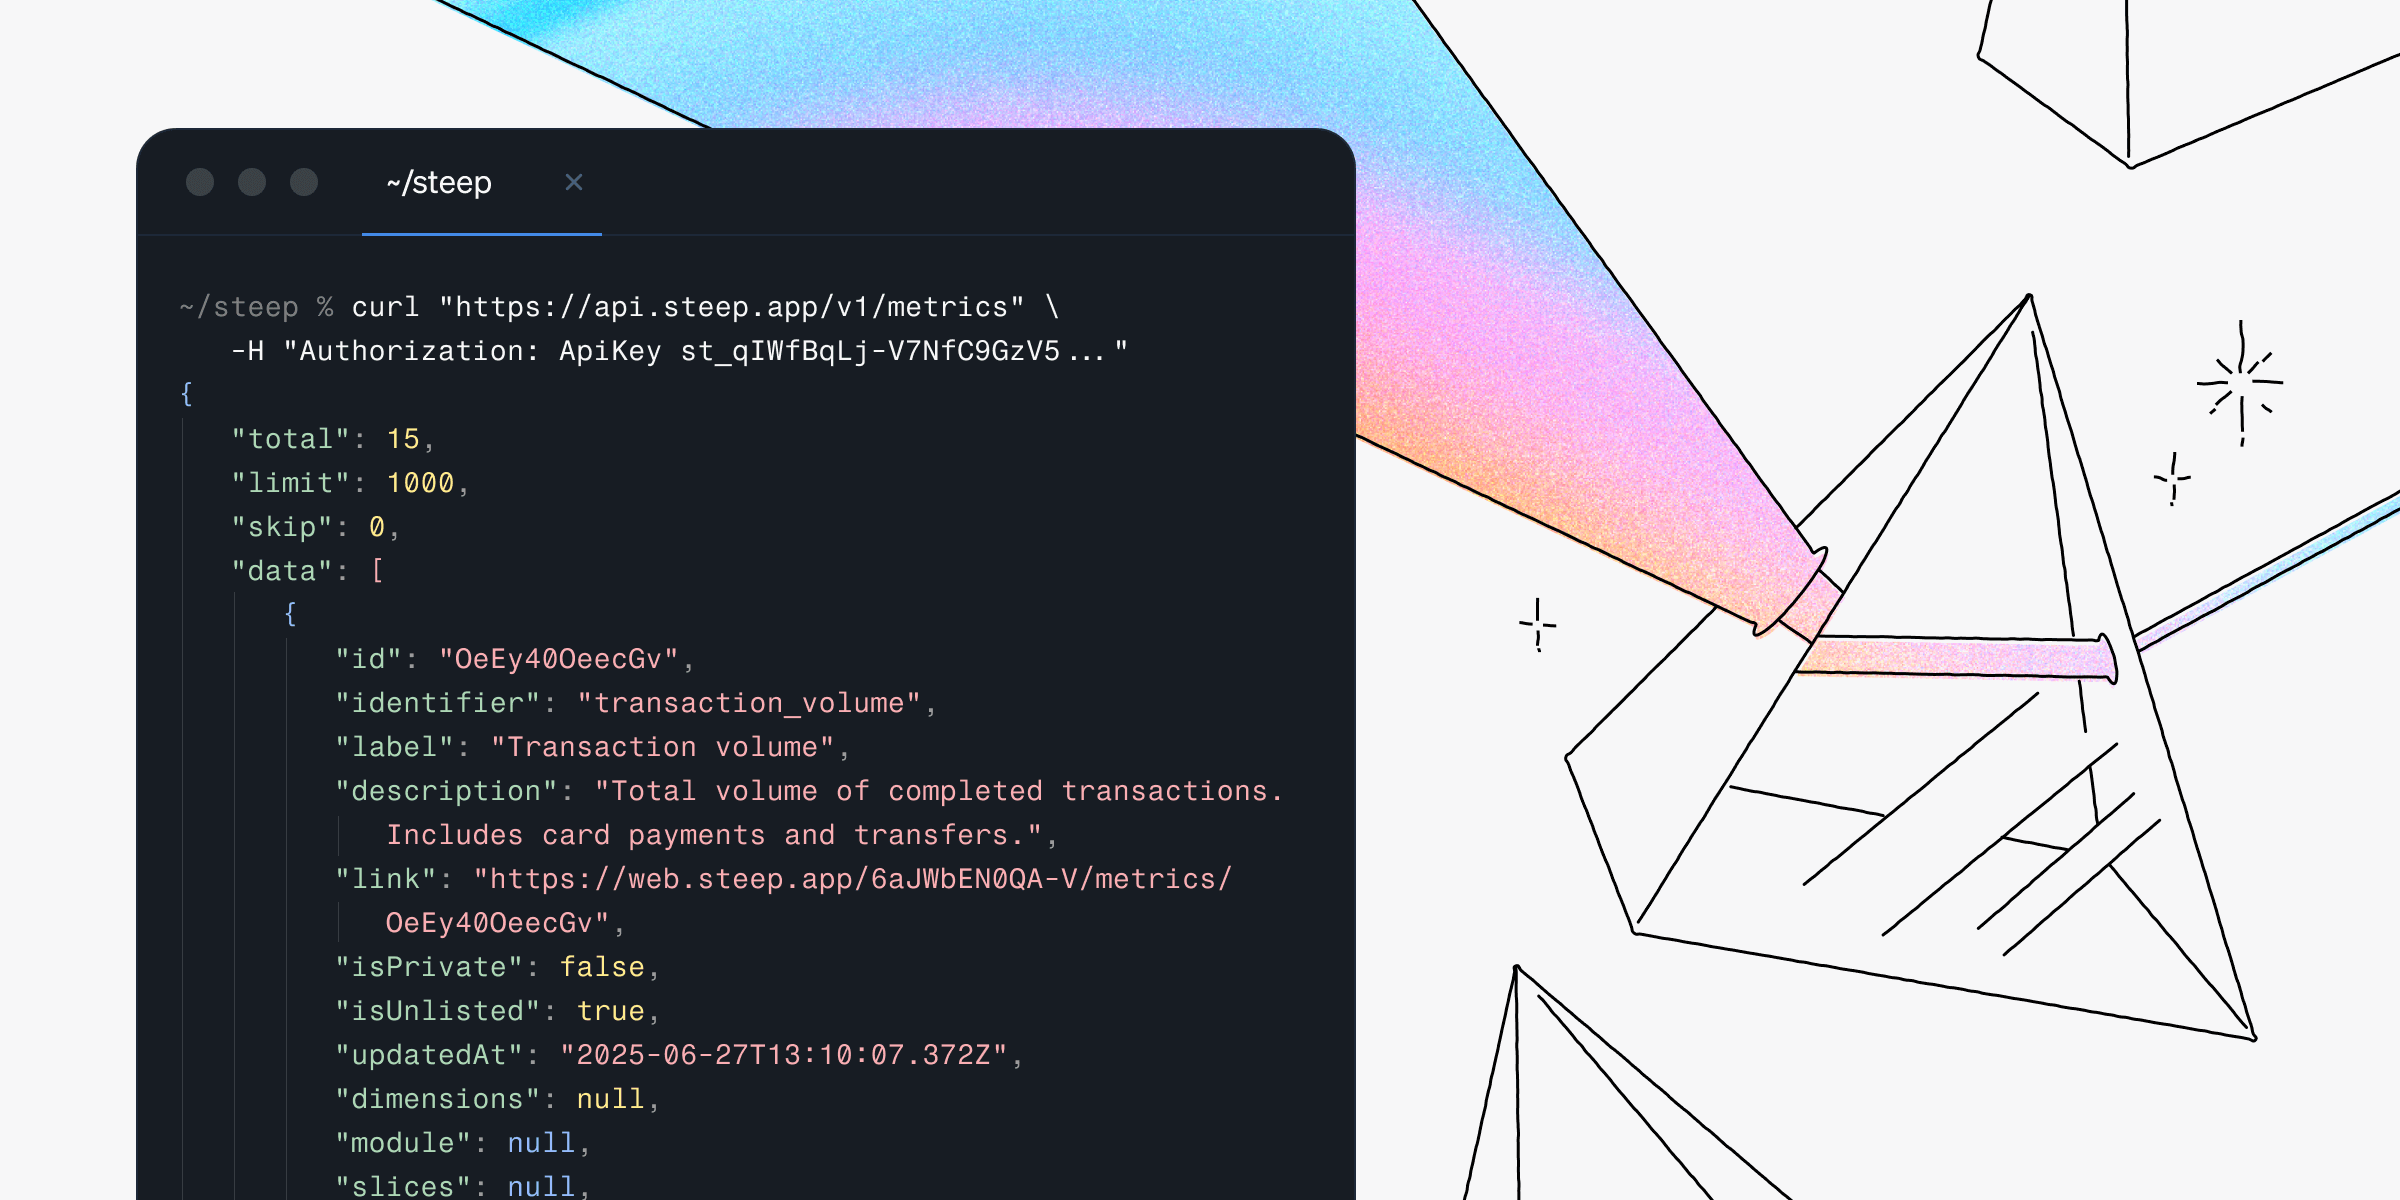
New in Steep: API – Metrics power anything
Introducing the Steep API, a major release that expands your centrally defined metrics beyond Steep’s UI and into anything you build.

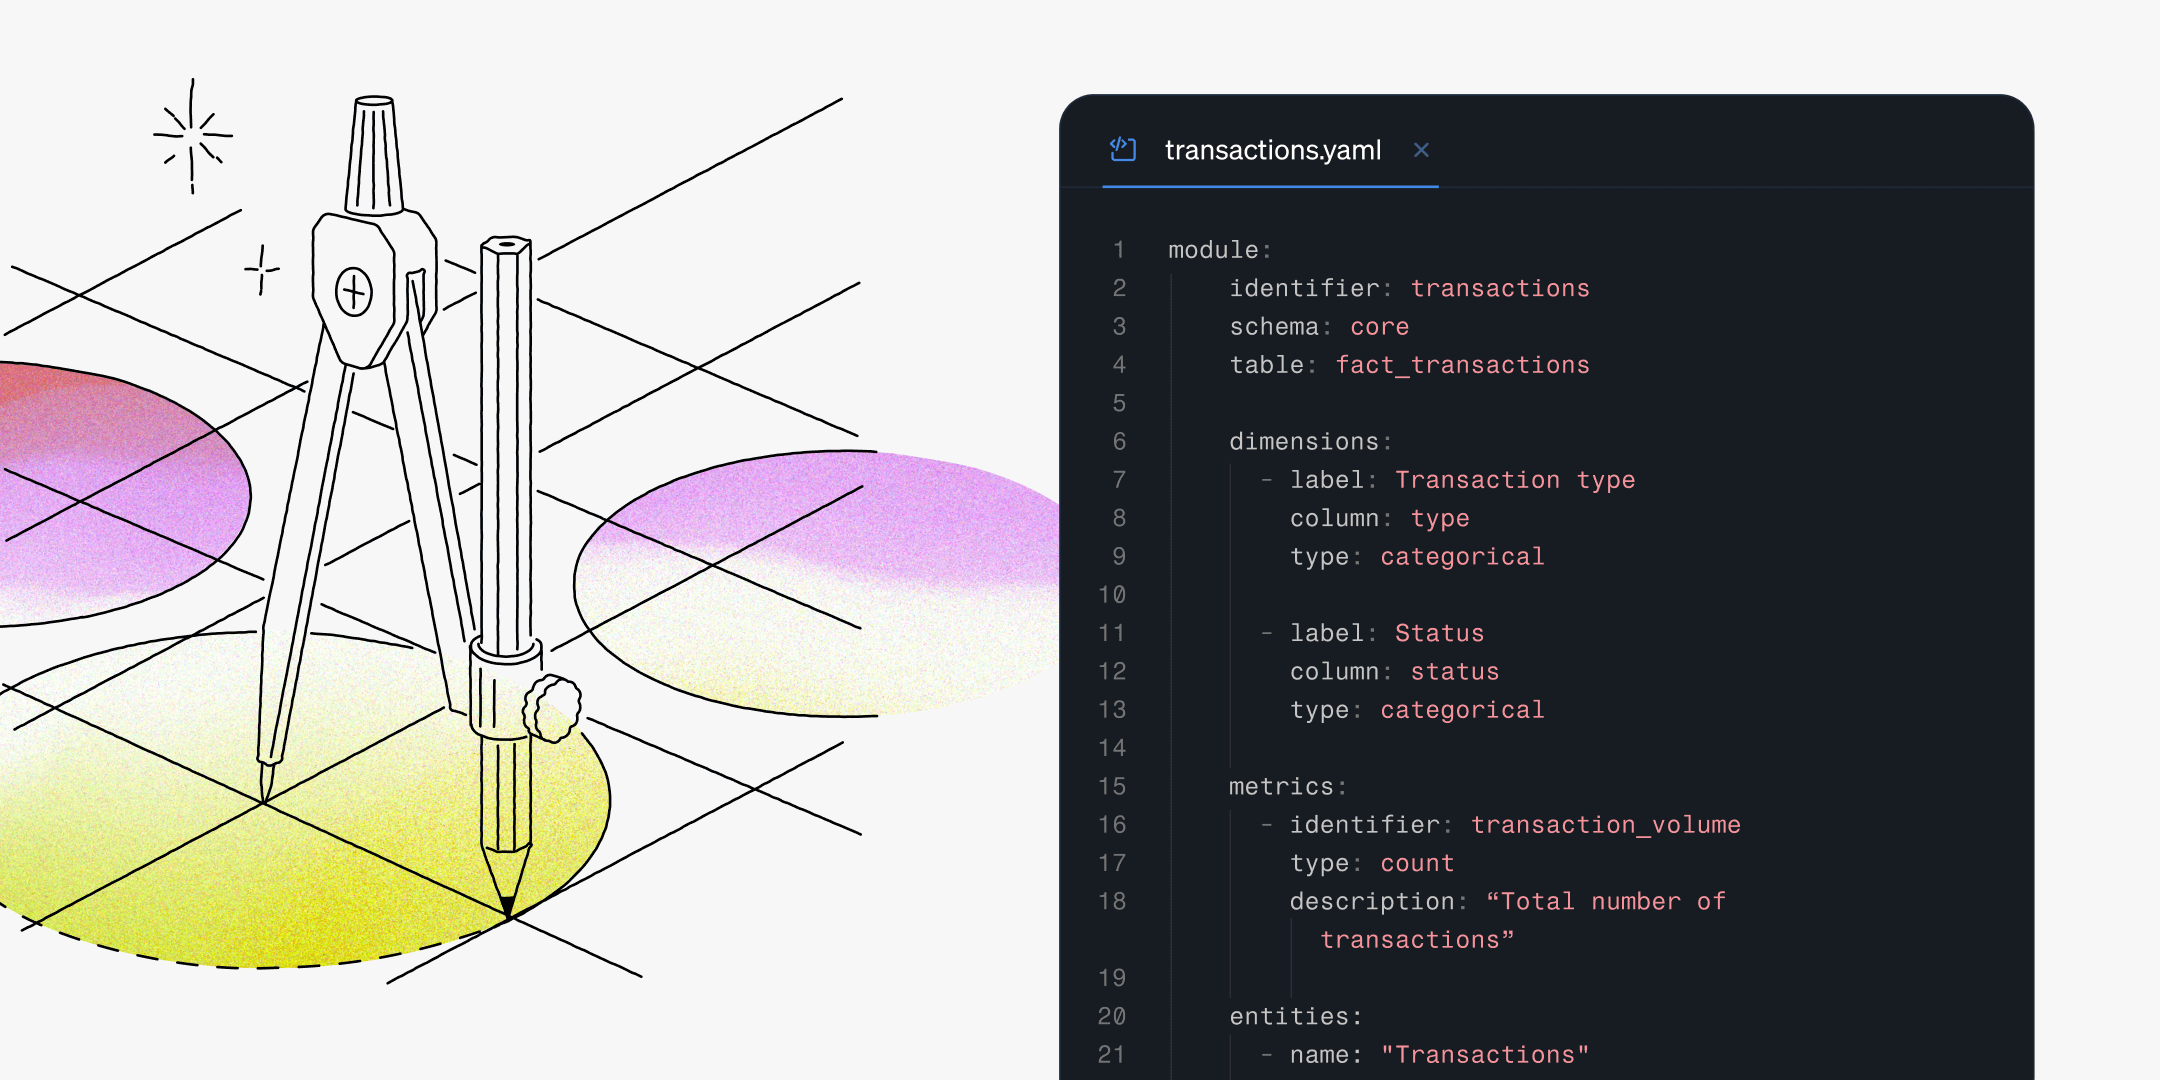
New in Steep: Define in code
We’re excited to release a game-changing update that takes the Steep experience to a new level. Define in code is a long-anticipated feature that gives data teams unmatched structure and flexibility.
5 key requirements for a successful semantic layer
The semantic layer is not a fad. It's the foundation for modern data teams. This blog will break down the requirements for a semantic layer, and share best practices on how to ace your implementation.

Steep at Coalesce 2025
Steep is back as a sponsor at Coalesce by dbt Labs for the second year. On the 13-16 October, our team is returning to Las Vegas to connect with the data community and explore the latest in analytics.

New in Steep: More flexibility, better control
Our most recent updates improve comparing and exploring your data and gives the data team new tools for advanced configuration and governance.
New in Steep: Put your metrics on the map
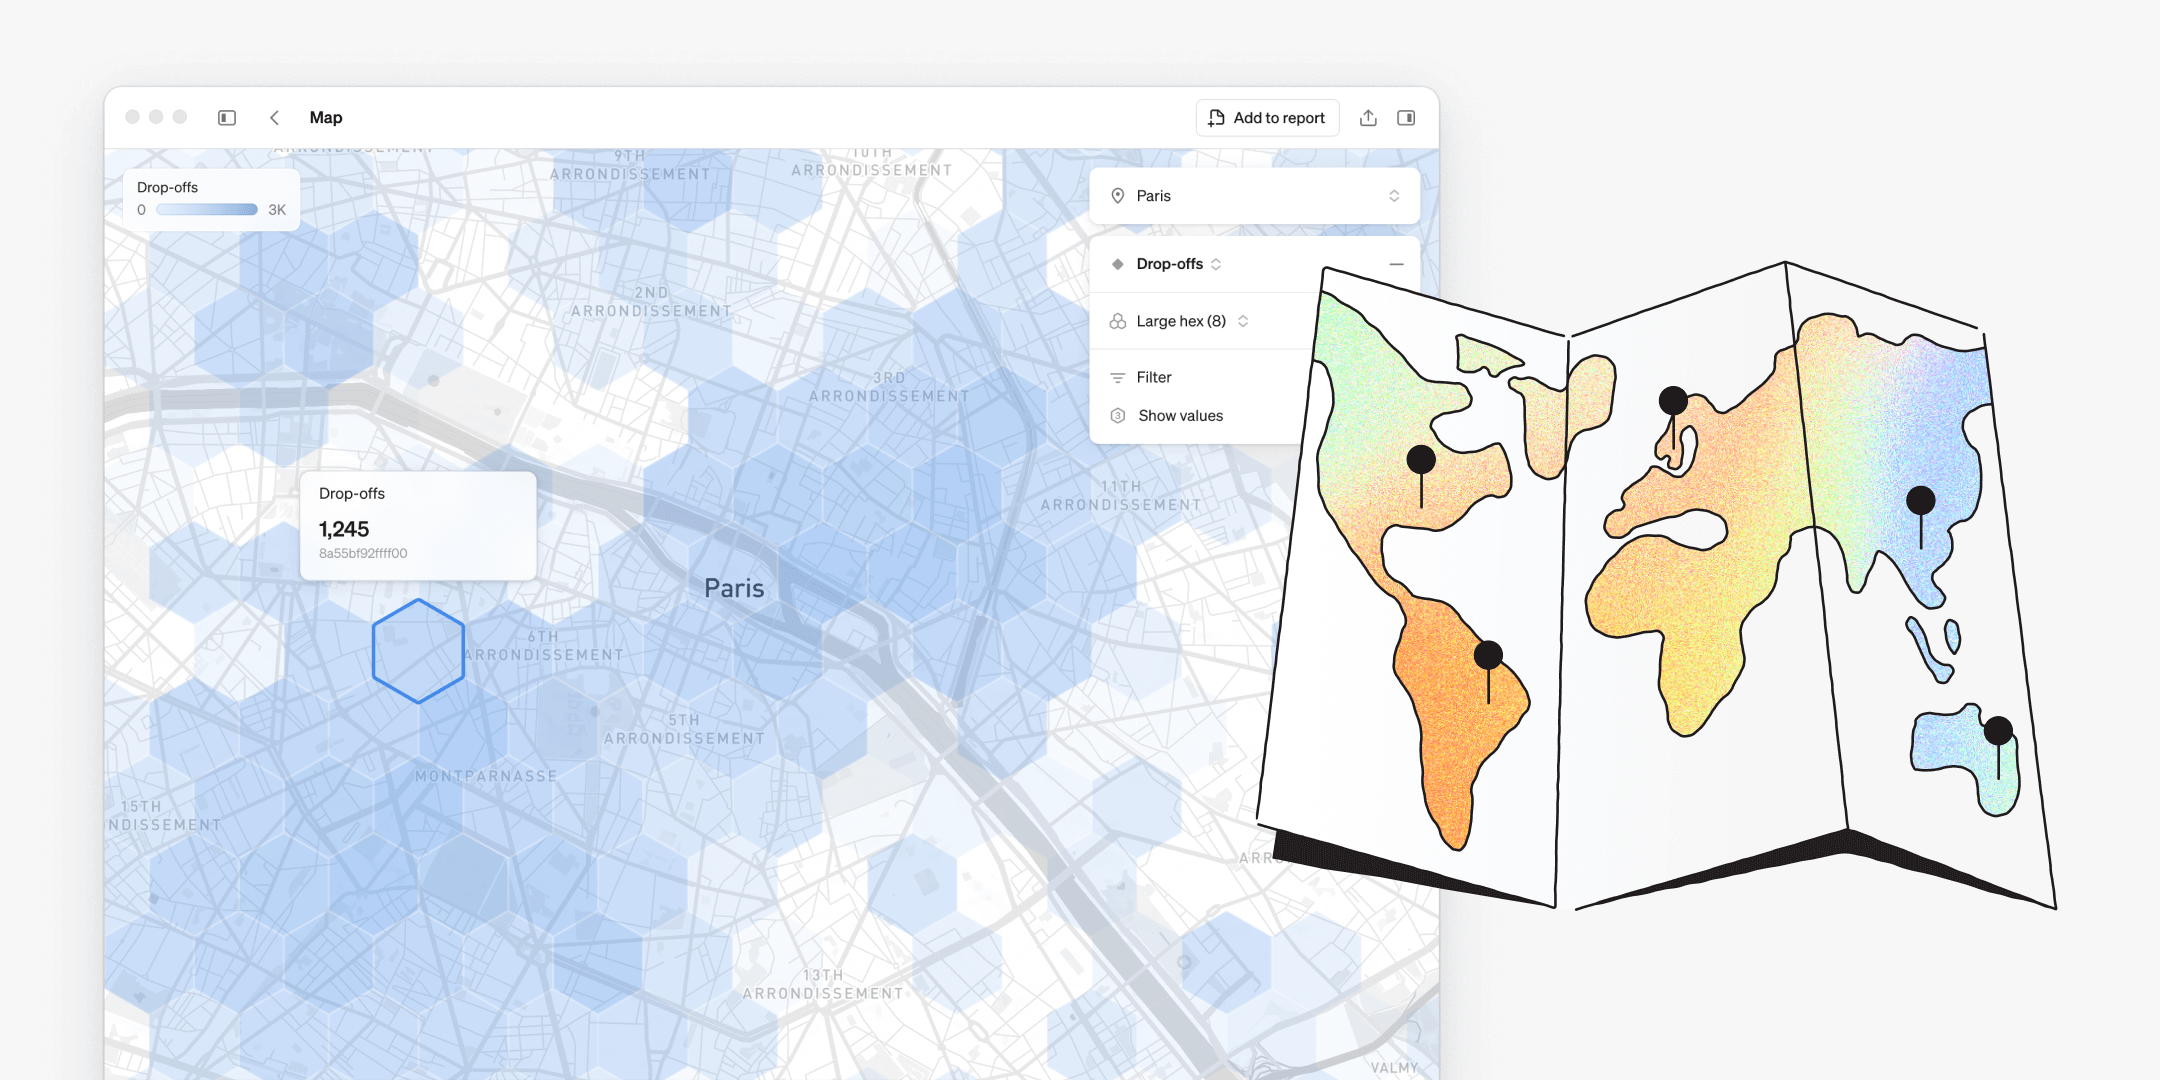
We’re thrilled to introduce the newest feature in Steep – maps. Traditionally, maps were time-consuming to build, required a specialist and offered limited flexibility for end users. With maps in Steep, anyone can create rich, location-based visualizations in seconds – fully integrated with the semantic layer.
New in Steep: Sharper customization
This month's updates bump up table features and customization options, with new color schemes, full-width reports, and clearer value displays. These improvements give you more intuitive ways to explore and present your data in Steep.
Dashboards are dead - 3 reasons to go metrics-first
How do you kill the dashboard monster? My weapon of choice is going metrics-first. Let me explain why with these three core concepts; abstraction, composability, and built-in consistency.

Fueling strategic data use across the business
Once Upon's data team was on a mission to bring end users closer to data. They helped transform analytics from a behind-the-scenes function to a driving force, making data accessible and easy to use for everyone.
New in Steep: 17 powerful upgrades
We've listened to our users and focused on small but mighty improvements that take your Steep-experience to the next level. Enjoy this month's product update with 17 improvements to Steep!
New in Steep: Smarter targets
Tracking performance against targets is an essential part of any business, but in most BI tools it's often complex and difficult to manage - especially for business users. Steep's metrics-first approach allows targets to be deeply integrated and effortless to manage.
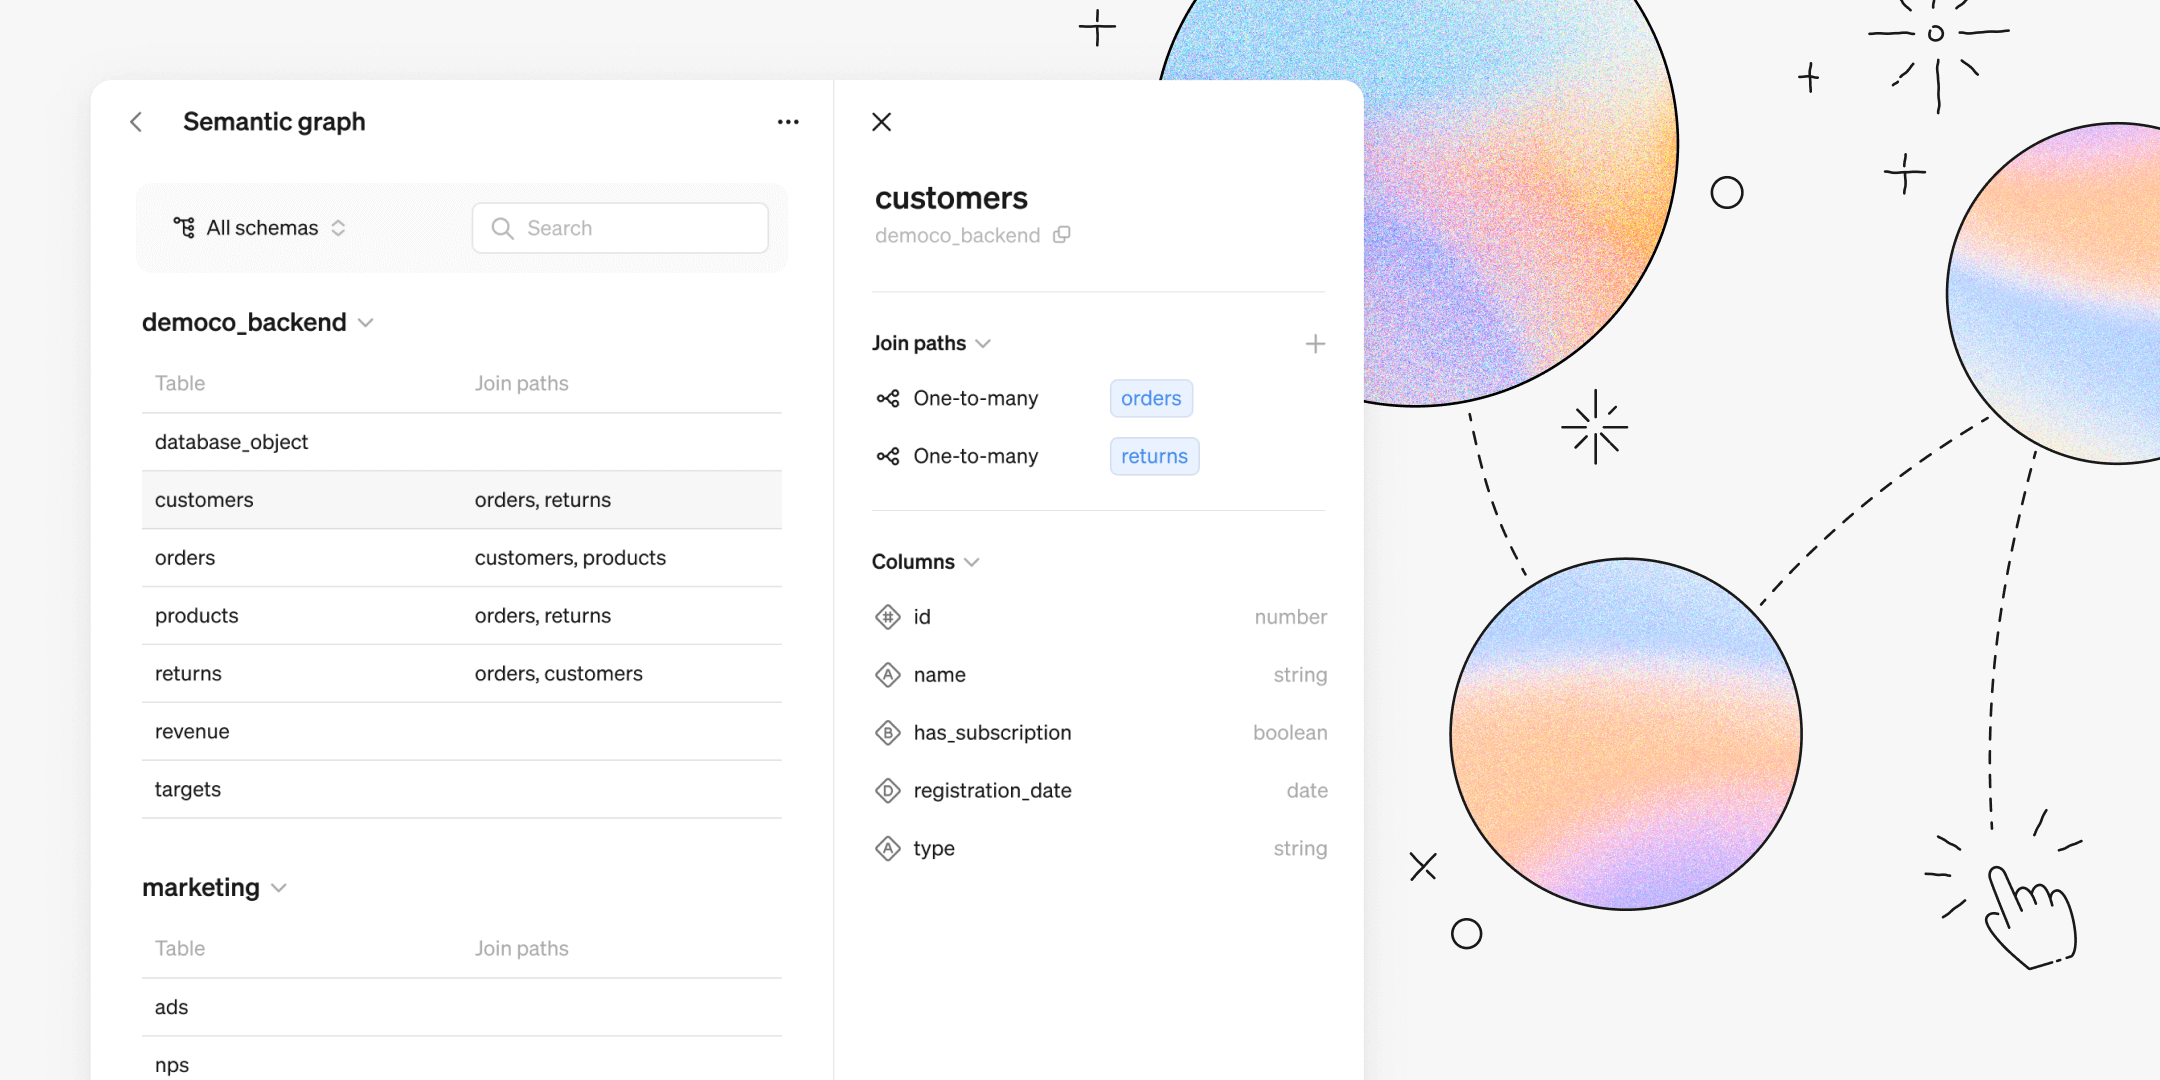
New in Steep: Semantic graph
Steep’s Semantic Graph gives you a complete overview of your data tables and their relationships, making it easier than ever to define join paths between them.

Ditching dashboards for scalable analytics
With growing data demands from the organization, Voi Technology swapped dashboards in Tableau for Steep’s metrics-first BI to boost engagement, enable data-driven decisions, and cut costs.
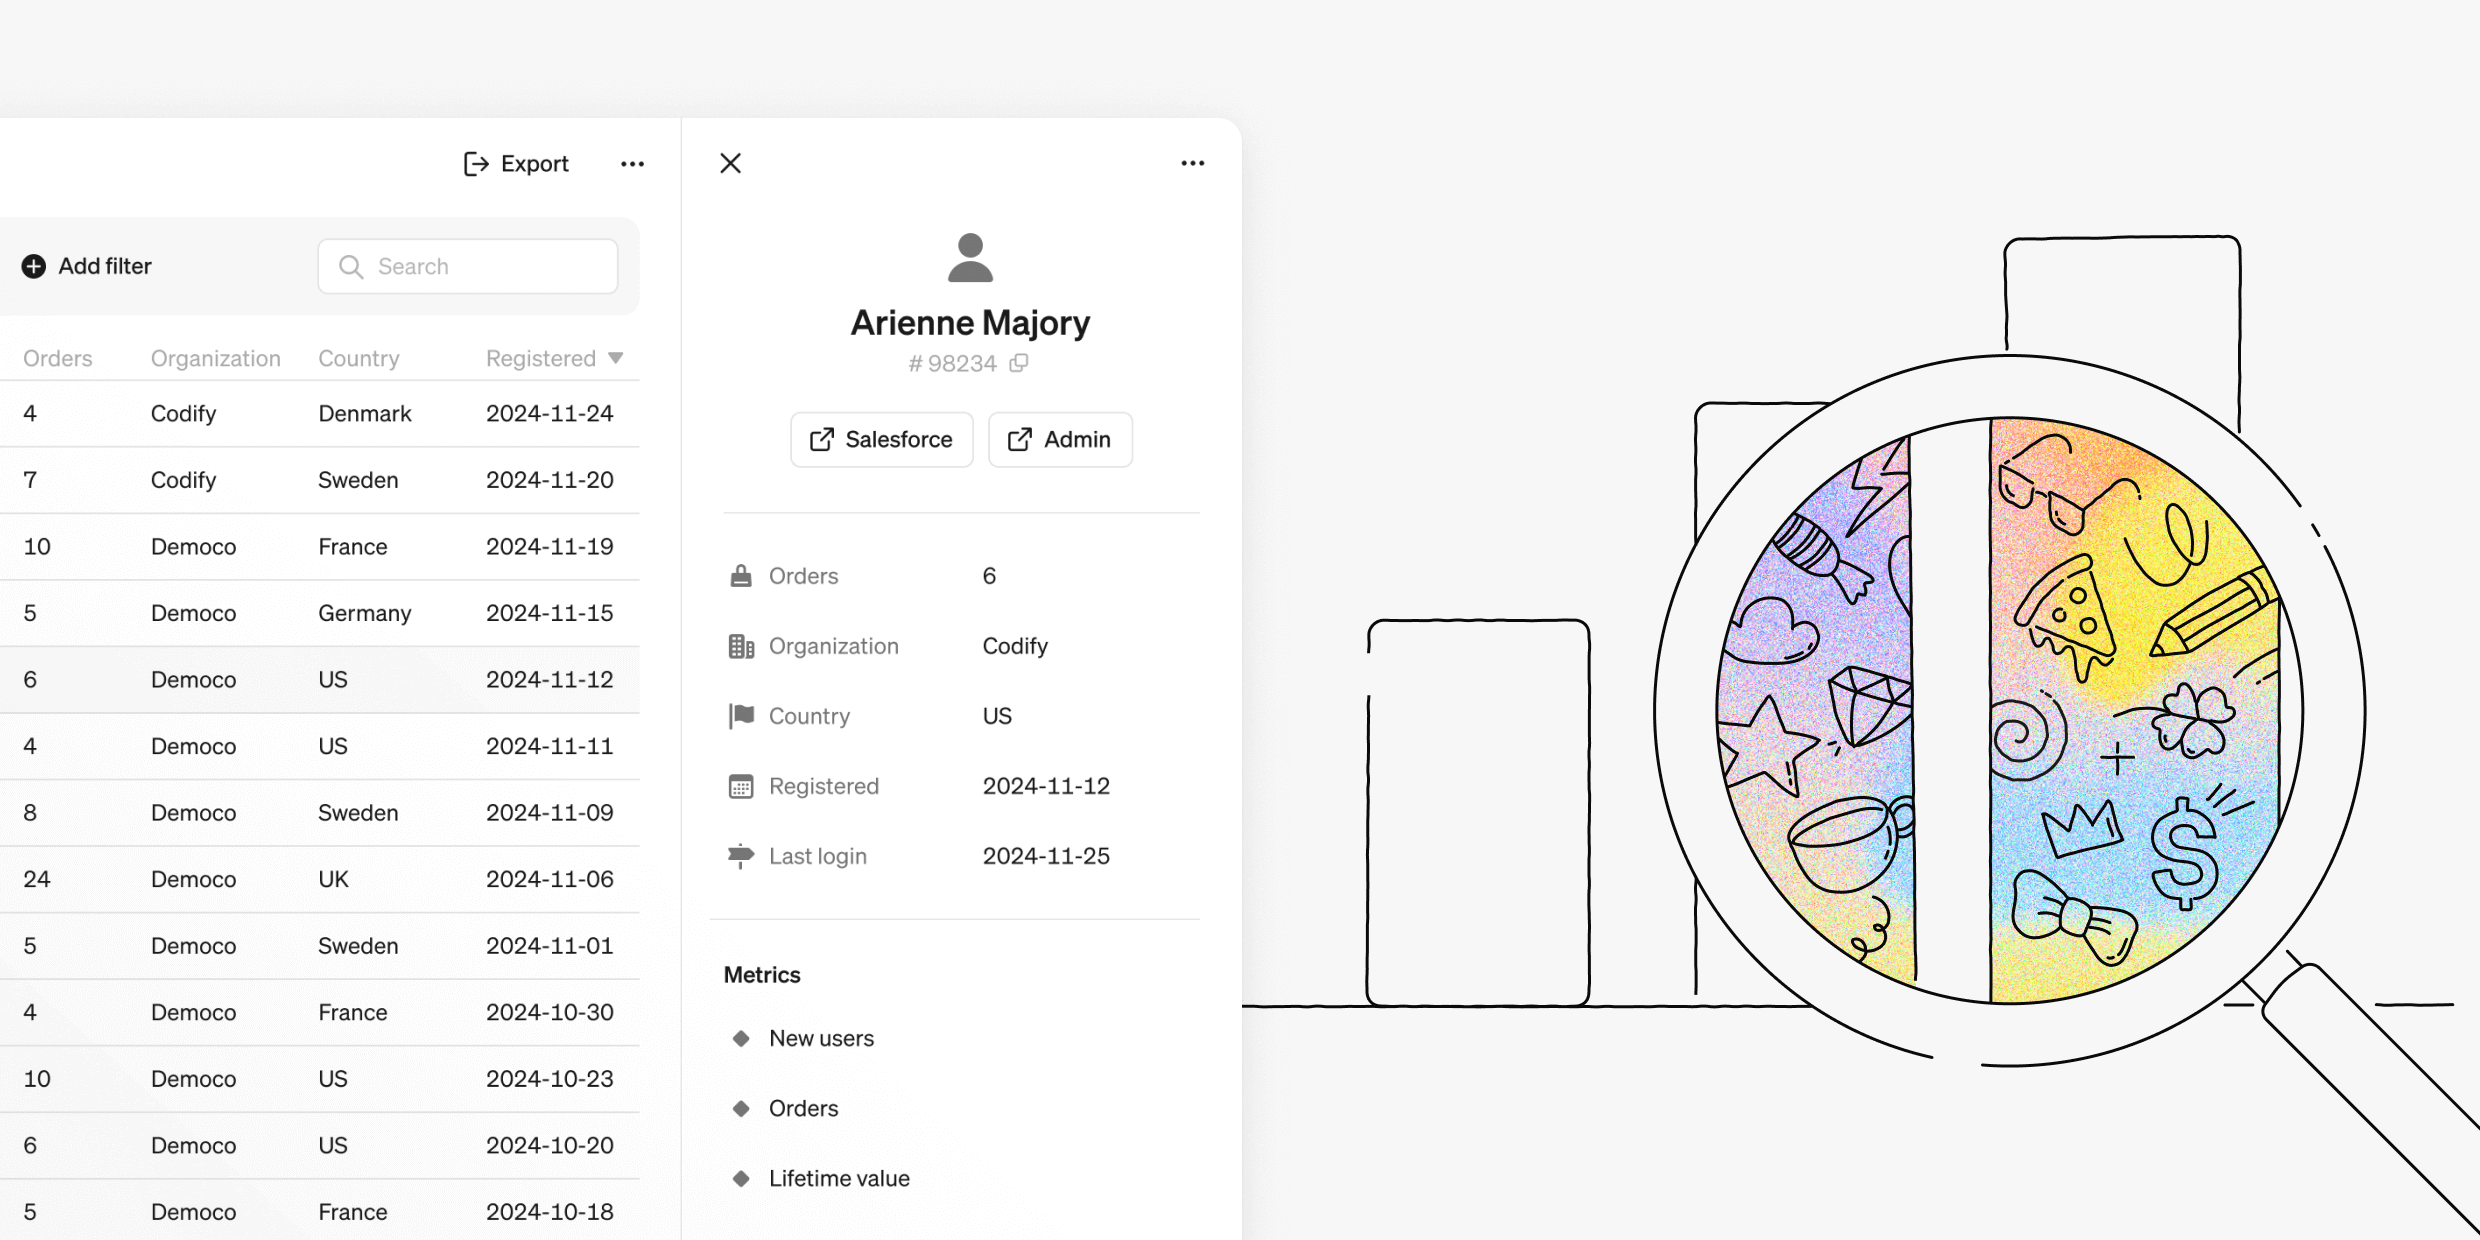
New in Steep: Entities
We're excited to introduce a game-changing addition to Steep's semantic layer. Entities unlock the power of row-level insights, giving you the tools to go beyond metrics and explore the granular details that drive your business.

Data made accessible with intuitive BI
Bounce was searching for a tool to centralize its data capabilities and empower all employees with an easy-to-use data and analytics tool. Here's why they chose Steep.

Why Pyne chooses Steep for data-driven clients
We talked with Emilio Biz, a data consultant at Pyne, to learn about his experience setting up and rolling out Steep for his e-commerce clients, and why they opt for Steep when choosing a BI tool.

New in Steep: Slack Subscriptions
We know it’s crucial for you to keep your company engaged and up-to-date on the latest insights while being smart about your time. So, we’re happy to introduce Slack Subscriptions, allowing you to seamlessly automate the delivery of reports to your team’s favorite workspace communication tool, Slack.
3 powerful ways to use pivot tables
There are fancier analysis techniques out there, but nothing beats a good pivot table for the sheer amount of insights you can get out of it. As a bonus, it’s easy to understand for large audiences, so it will make your insights pop. Adding a heat map is where the magic happens. Here are 3 powerful ways to use pivot tables:
Join Steep at Coalesce
We're excited to share that this year at Coalesce, we’ll be attending, hosting a talk, and having our own booth. Find all the details below. Can’t wait to see you there!
New in Steep: Reports Personalized
This month, we've rolled out a number of updates designed to take Steep reports to the next level, making them more powerful and fully customizable to suit your needs.
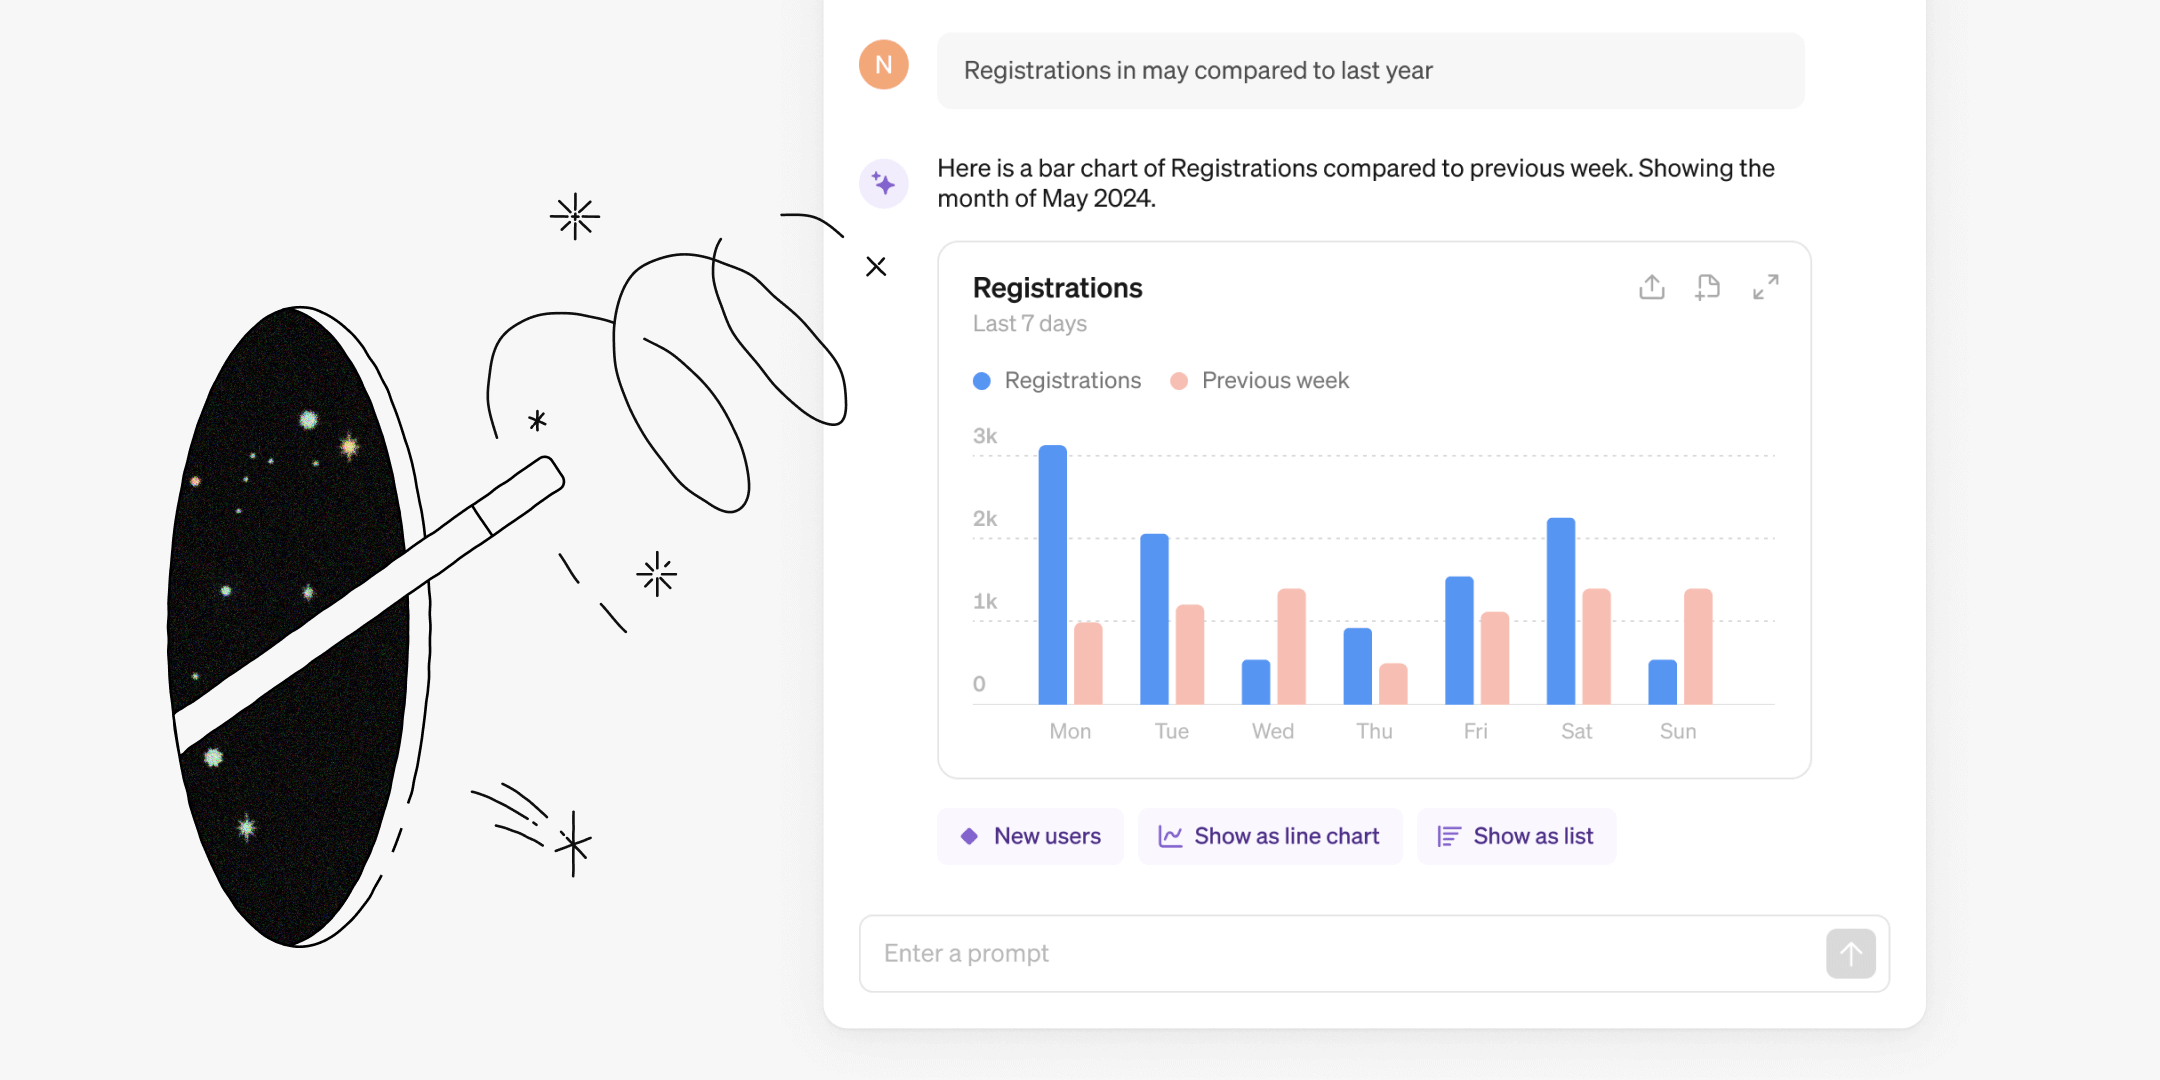
New in Steep: AI Chart Builder
Steep is on a mission to make data more useful, simple and enjoyable for everyone. This month, we’re excited to introduce the AI Chart Builder, a new intuitive way to explore and analyze metrics.

The next chapter for Steep
We're excited to share that Steep has raised €4 million in a seed funding round led by Connect Ventures, along with existing investor Inventure and participation from Alliance VC, Antler, and Greens.

New in Steep: Streamline your workflow
Our latest product updates are designed to simplify your workflow and make everyday tasks a breeze. Here’s how we’re addressing your most requested improvements:
New in Steep: Cohorts
This month, we’re excited to introduce cohorts! What was previously reserved for experts can now be built by anyone. Track how different groups of users behave over time and easily spot patterns in our latest visualization update.
New in Steep: You asked for it!
For our second update this month, we’re launching several requested improvements to make analysis even easier and more intuitive. These include keeping context when analyzing metrics, improved filters and active member tracking.

New in Steep: Pivot tables, targets and more
This month we’re introducing pivot tables, upgraded targets and pinning reports to your home and team screens.
Targets & BI - How hard can it be?
TL;DR: Adding targets to your BI visualizations remains unreasonably hard. It frustrates your business controller peers while draining your team's time. Current approaches are essentially hacks and the time has come for a proper solution.
Why Semantic Layer is the next paradigm for BI
Unlike the modern data stack, BI hasn't evolved much in the last ten years. Here's why the Semantic Layer is the new paradigm we need to serve the data-driven companies of the future.

New in Steep: dbt integration
We’ve teamed up with dbt Labs to bring you a complete semantic stack! With the new integration, you can now connect Steep to the dbt Semantic Layer via dbt Cloud. This lets you build your semantic layer with code in dbt Cloud and publish your metrics to all your end users in Steep.
New in Steep: Cube integration
We have partnered up with the good folks at Cube to bring you a powerful semantic combo. With the new Steep + Cube integration you can now connect Steep to an external semantic layer powered by Cube. Build your semantic layer with code in Cube, and publish your metrics to all your end users in Steep.
New in Steep: Filters in reports
This month, we're rolling out filters in reports, a powerful feature designed to add a layer of flexibility to your reporting experience.
Analytics for startups
If you're running a startup and thinking about your data setup - good news! Getting started is not that hard anymore, and you don't need a data specialist. This is how we did it at Steep.
New in Steep: Tables
This month, we’re introducing powerful and intuitive tables that work like you expect in 2023.

When building a data culture - start with getting teams focused on impact
One of the big frustrations I’ve had as a data leader is working with teams that are too busy shipping to care about impact and analysis. Here’s my approach.
Why data leaders have the hardest job in tech
I’ve been an analytics leader three times over, and my friends - we sure didn't choose this job because it’s easy!
New in Steep: Search, caching and more
Wondering what we’ve been working on lately? Check out the latest updates below.

dbt MetricFlow - semantic layer 2.0
dbt is doubling down on the semantic layer and this time it’s serious.
How we ended up building a Notion for data
The other day Janne, one of the developers on the team, turned around and said - oh I just got totally mixed up, I thought I was in Notion but I was actually in Steep!
New in Steep: Next-level analysis
This month we’re introducing more ways to analyze, combine and visualize your metrics, all in one place.
The new Steep
The product has come a long way in two years, the mission remains the same.
New in Steep: Reports reimagined
This month we are bringing you a whole new way to create, collaborate and communicate with data - introducing the new Reports.
New in Steep: Metrics catalog and joins
This month we are introducing new ways of bringing order to your metrics and more flexibility defining metrics with joins. Read on for more.

New in Steep: dbt integration and more
Steep has partnered up with dbt to provide a best-in-class metrics integration. But that’s not all. Read on for more exciting updates.
New in Steep: Team spaces, Help center
This month we are making it easier to grow with Steep using Team spaces, launching a completely new Help center, as well as adding a few nice visualization improvements.
New in Steep: Demo mode, Mac app and much more
Trying out Steep is now easier than ever with the introduction of demo data. There are plenty of new features this month, so make sure you read to the end for a special treat 🍰
New in Steep: Rank, compare, custom templates
The year is coming to an end and we are wrapping up with a whole bunch of new features and improvements. Our focus has been on enabling even more teams to be able to use Steep as well as new ways of gaining insights from your data. A big thanks to all of you for this year! Let's get to the news.
New in Steep: New edit mode, permissions
Early last month marked the public release of Steep. Thanks to everyone who signed up and got started so far. Please keep the feedback coming! We have not been idle in the meanwhile and there is a a whole bunch of news to share - so let's get right to it.
Announcing Steep
Im very glad to share the next step in our journey with Steep - announcing that we raised €1M pre-seed round co-led by Alliance and Inventure, and that today we are launching Steep to general access!