Steep is on a mission to make data more useful, simple and enjoyable for everyone. This month, we’re excited to introduce the AI Chart Builder, a new intuitive way to explore and analyze metrics.

Talk to your data
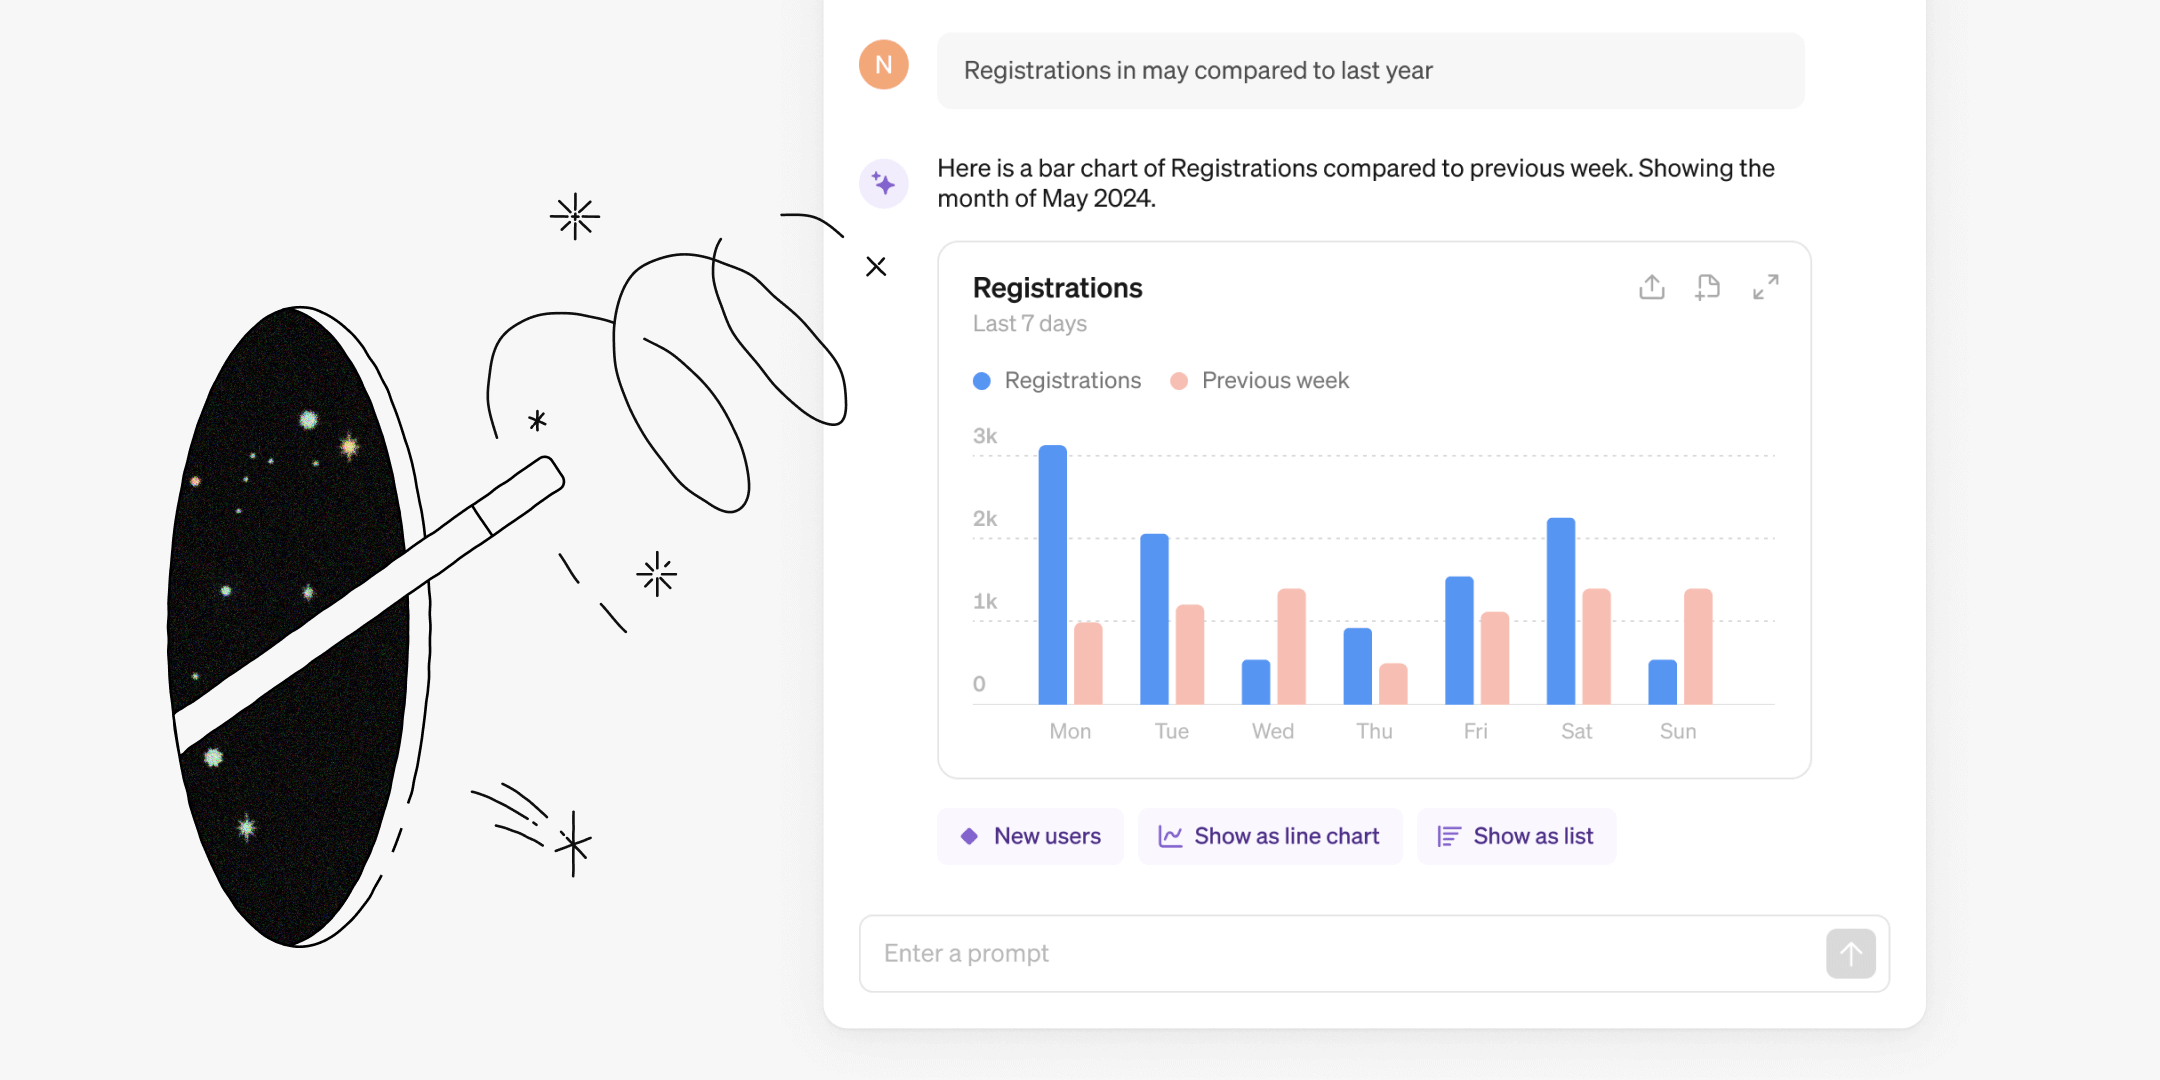
Simply ask Steep AI what you’re looking for, and it will generate a relevant chart from your metrics catalog. The charts can then be explored, shared, or saved to a report.
The chart builder supports:
- Creating charts of any metric in your catalog
- Various chart types (rank, line and bar)
- Relevant time periods and time grains
- Comparing with other metrics, time periods or targets
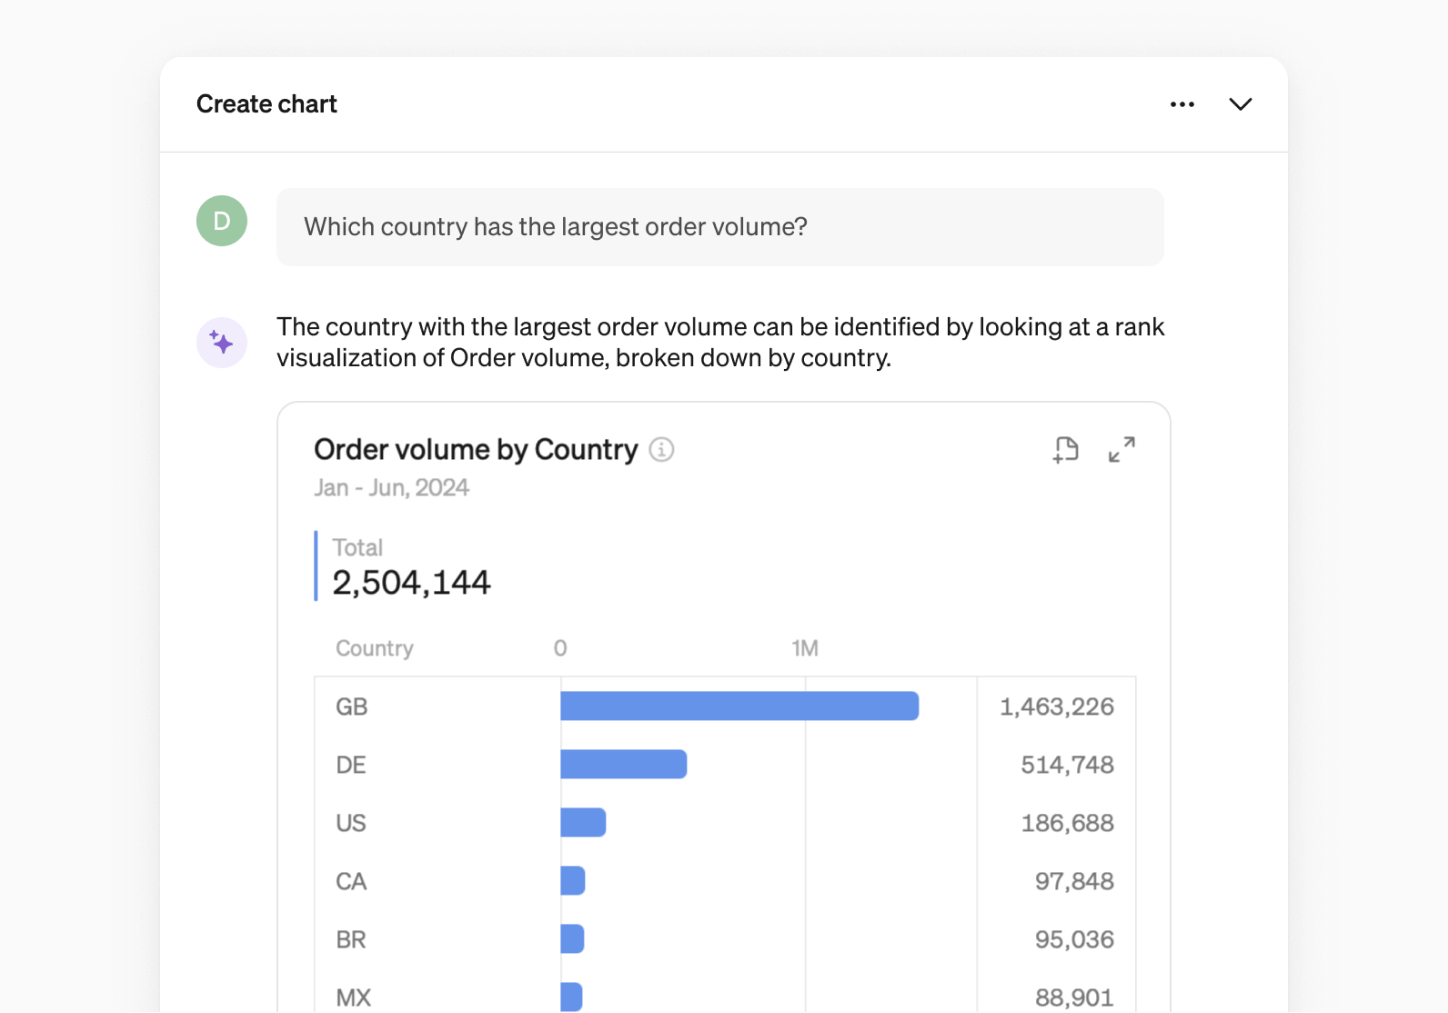
- Detailed breakdowns by dimension
How it works
Steep AI uses the the metadata from the semantic layer to determine which chart to generate. No data from your data warehouse is exposed to Steep AI.
Answers you can trust
Since all charts are built from your metrics catalog, you can always trust the charts Steep AI generates.
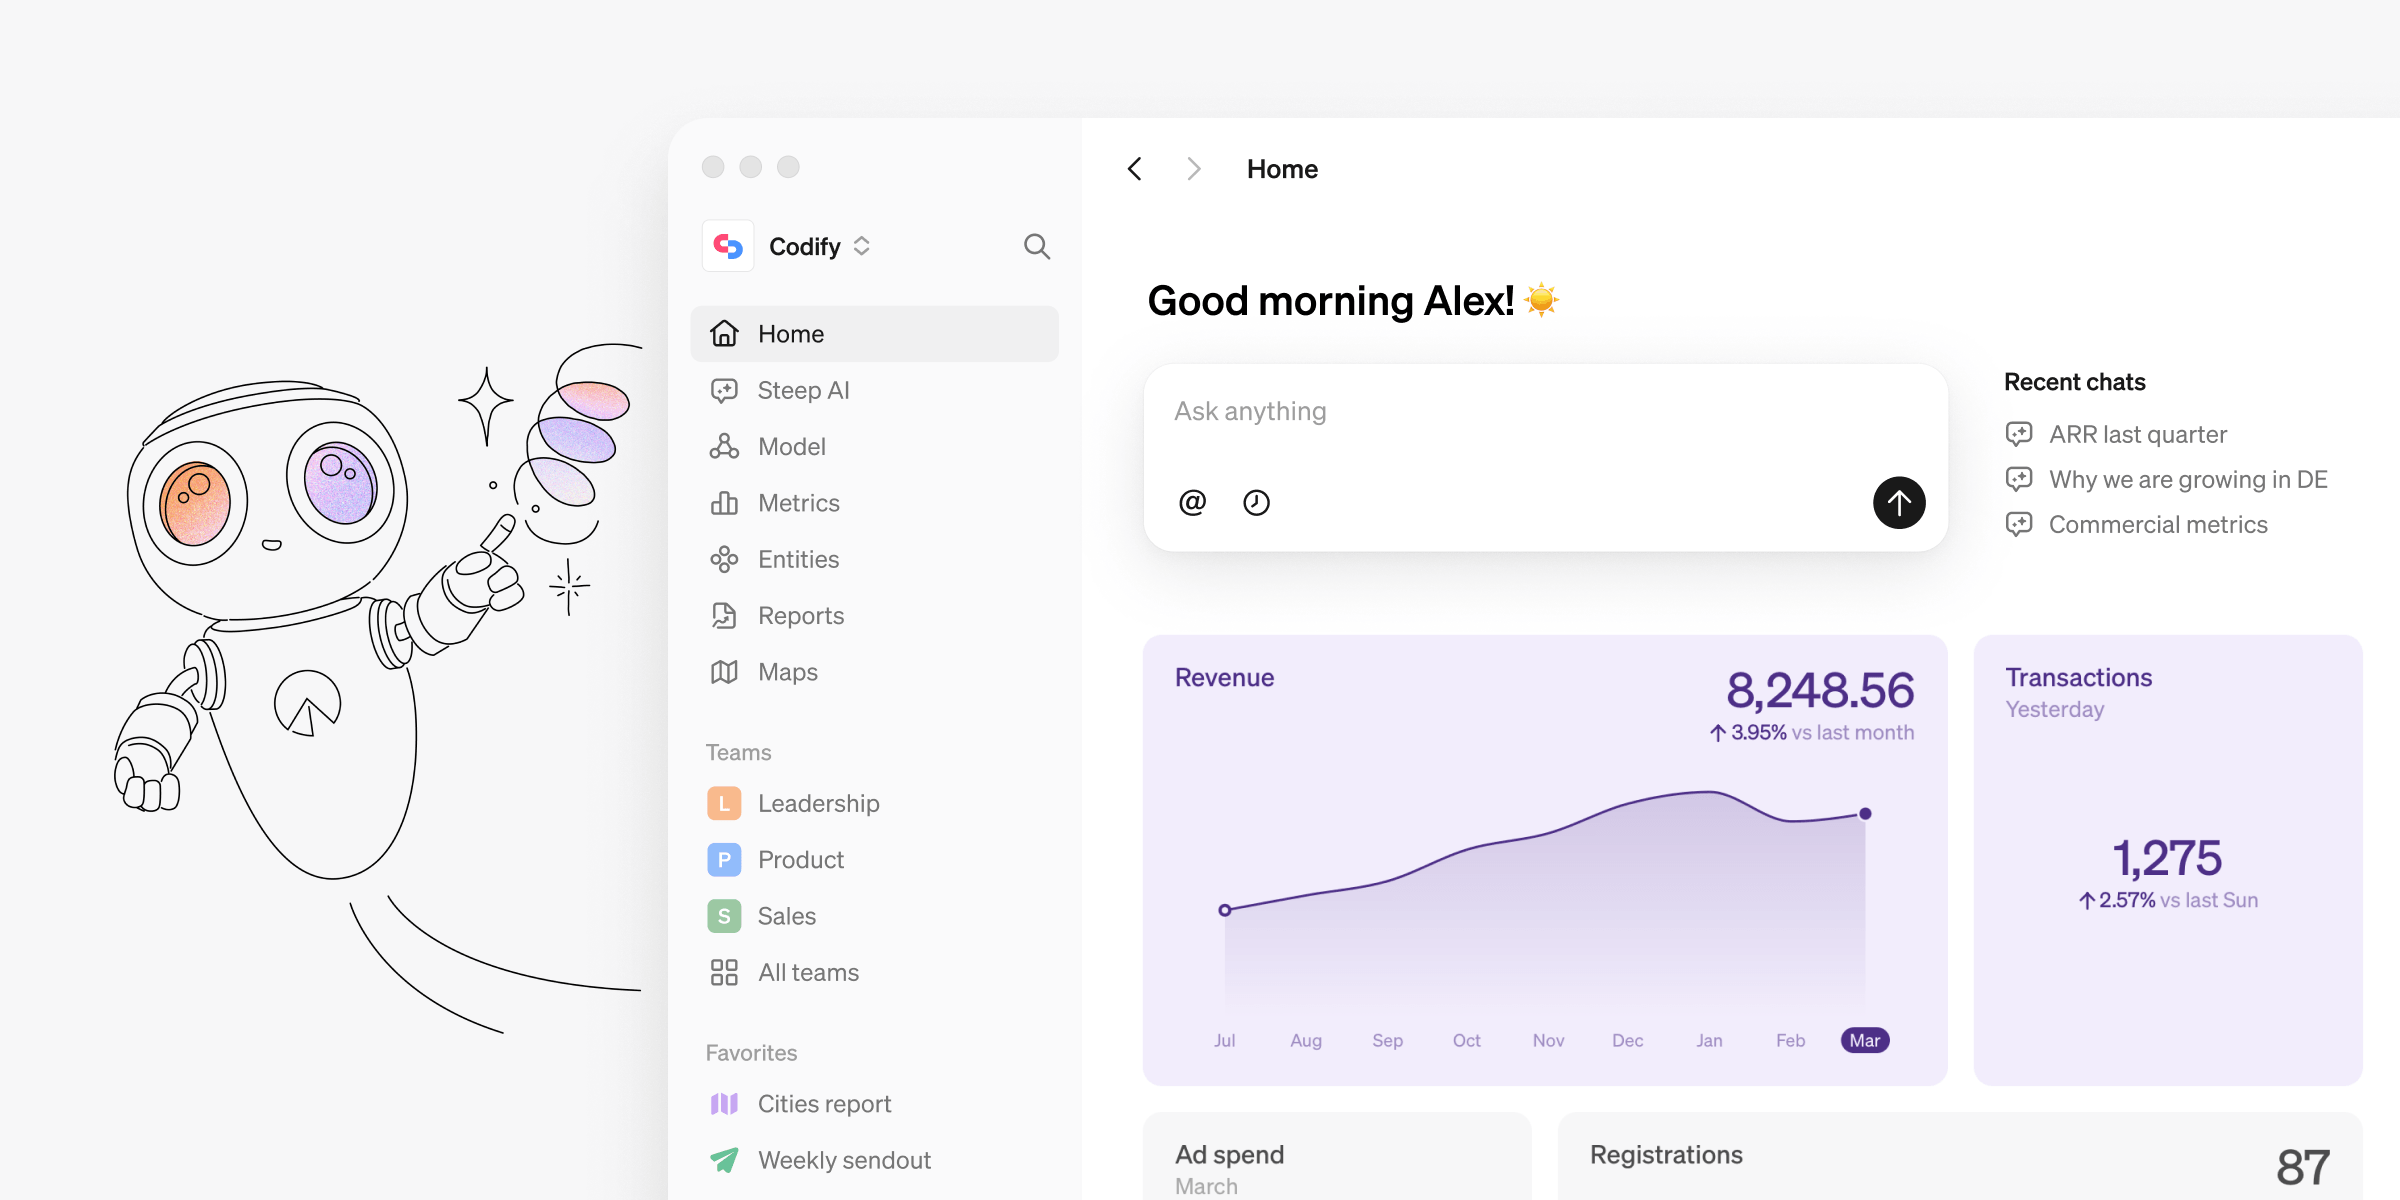
Available everywhere
You can use the Steep AI chart builder everywhere in the Steep app. Just click the Steep AI button in the bottom right corner and start typing.
Context-aware
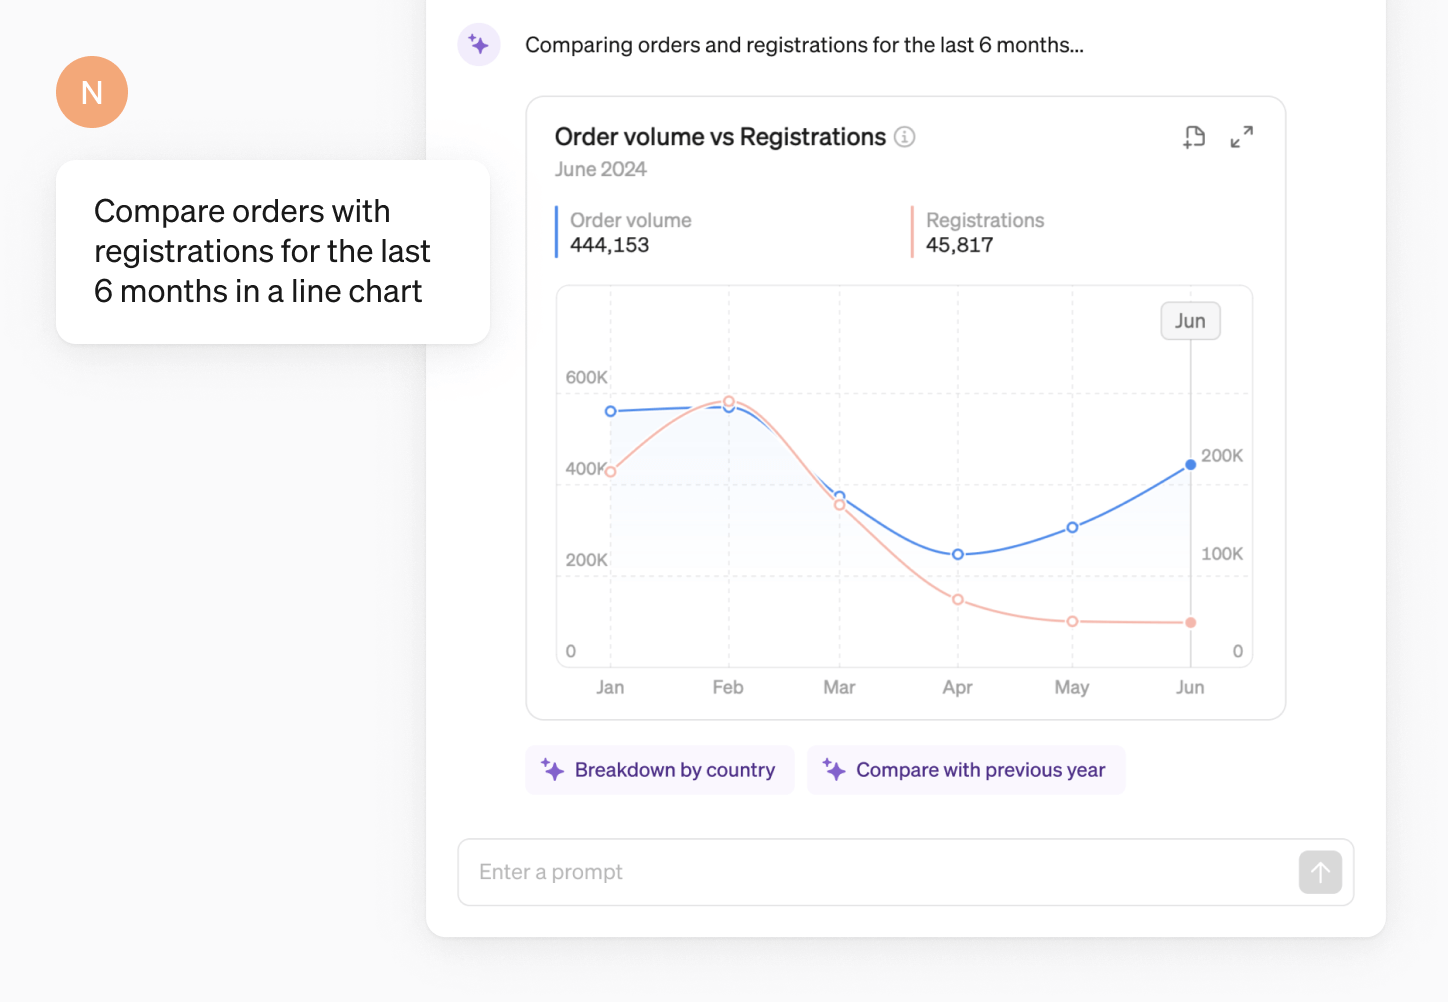
Steep AI is context-aware, so you can ask follow-up questions to refine the chart, to get exactly what you are looking for, and to keep digging deeper.
Suggested prompts
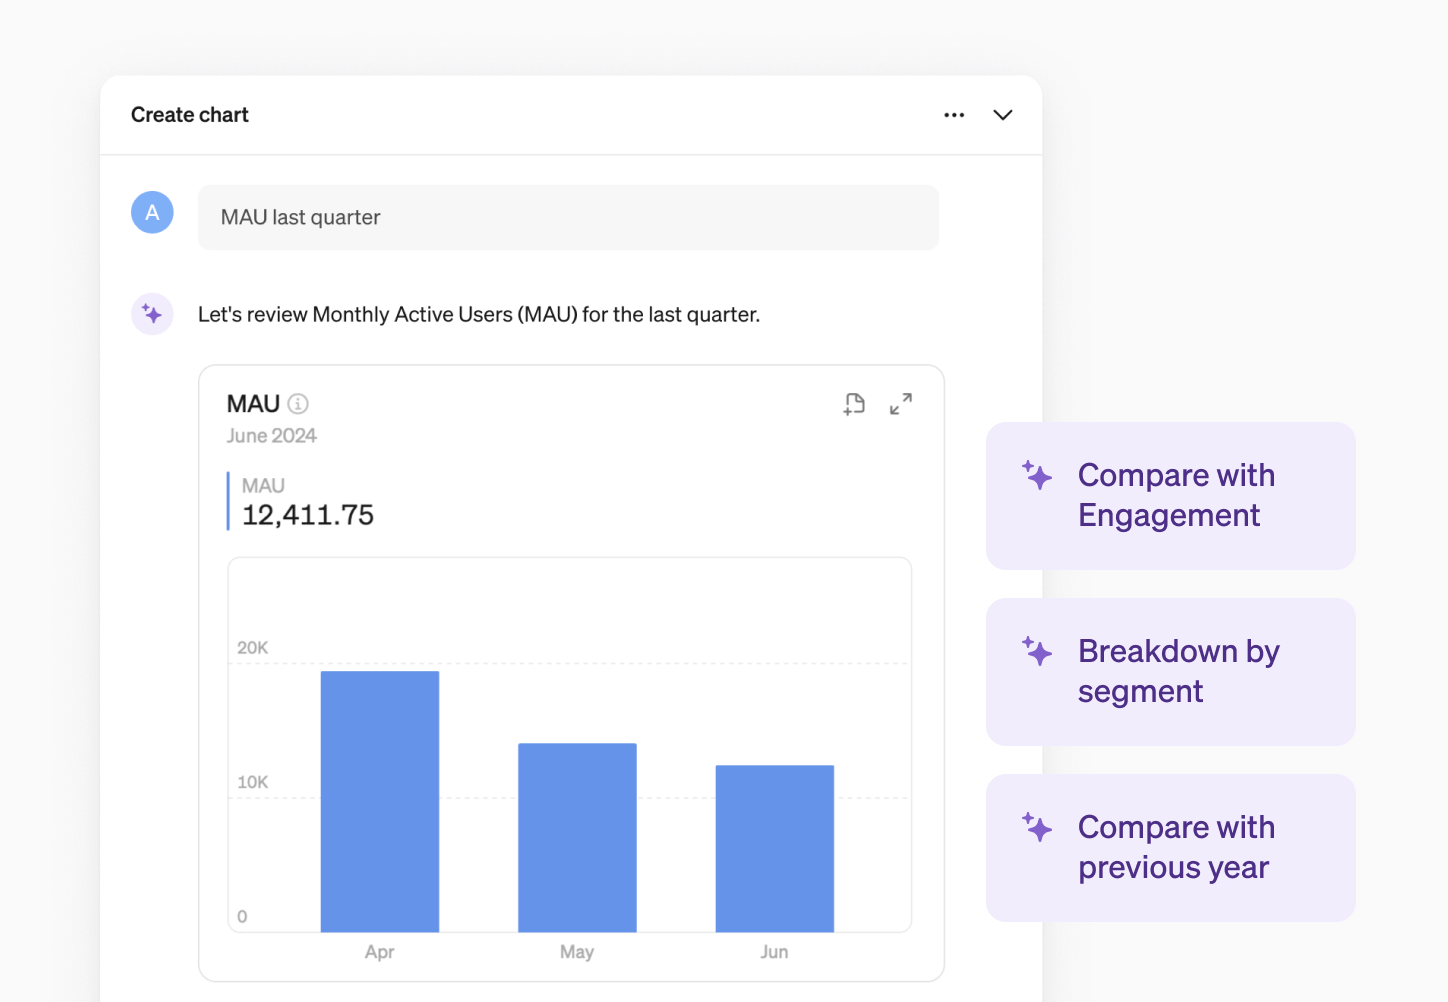
Sometimes, getting started is the hardest part. That’s where suggested prompts come in handy. Just click on a suggested prompt and Steep AI will generate the chart in seconds.
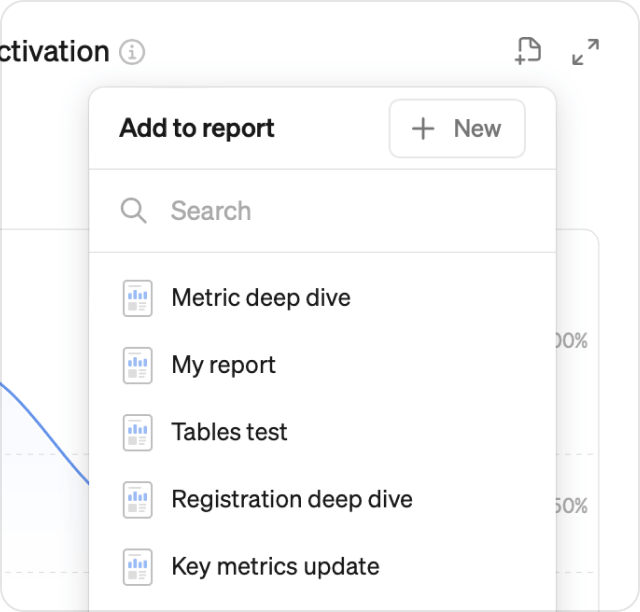
Using your charts
Any chart you generate can be saved to a report or explored further.
- Add charts to a new or existing report directly from the chat box.
- The explore button takes you to the metric screen and includes all parameters
Join the Beta
The AI chart builder is currently in beta. Contact us using the link below to join. You will need a workspace with at least a few metrics for the chart builder to work.
Book a demo
Get help with exploring the platform and discussing use cases for your team.
Get started
Explore for free. Get your own workspace or try the demo setup.
More posts

Intro to Steep
By Janna Pollari·Events
Webinar with Daana
By Janna Pollari·Events

Meet us at Snowflake Summit 2026
By Deanne Anderson·Events
Introducing Steep AI
By Nino Höglund·Product

A builder's guide to the Steep API
By Hanna Kjellén·Inside Steep
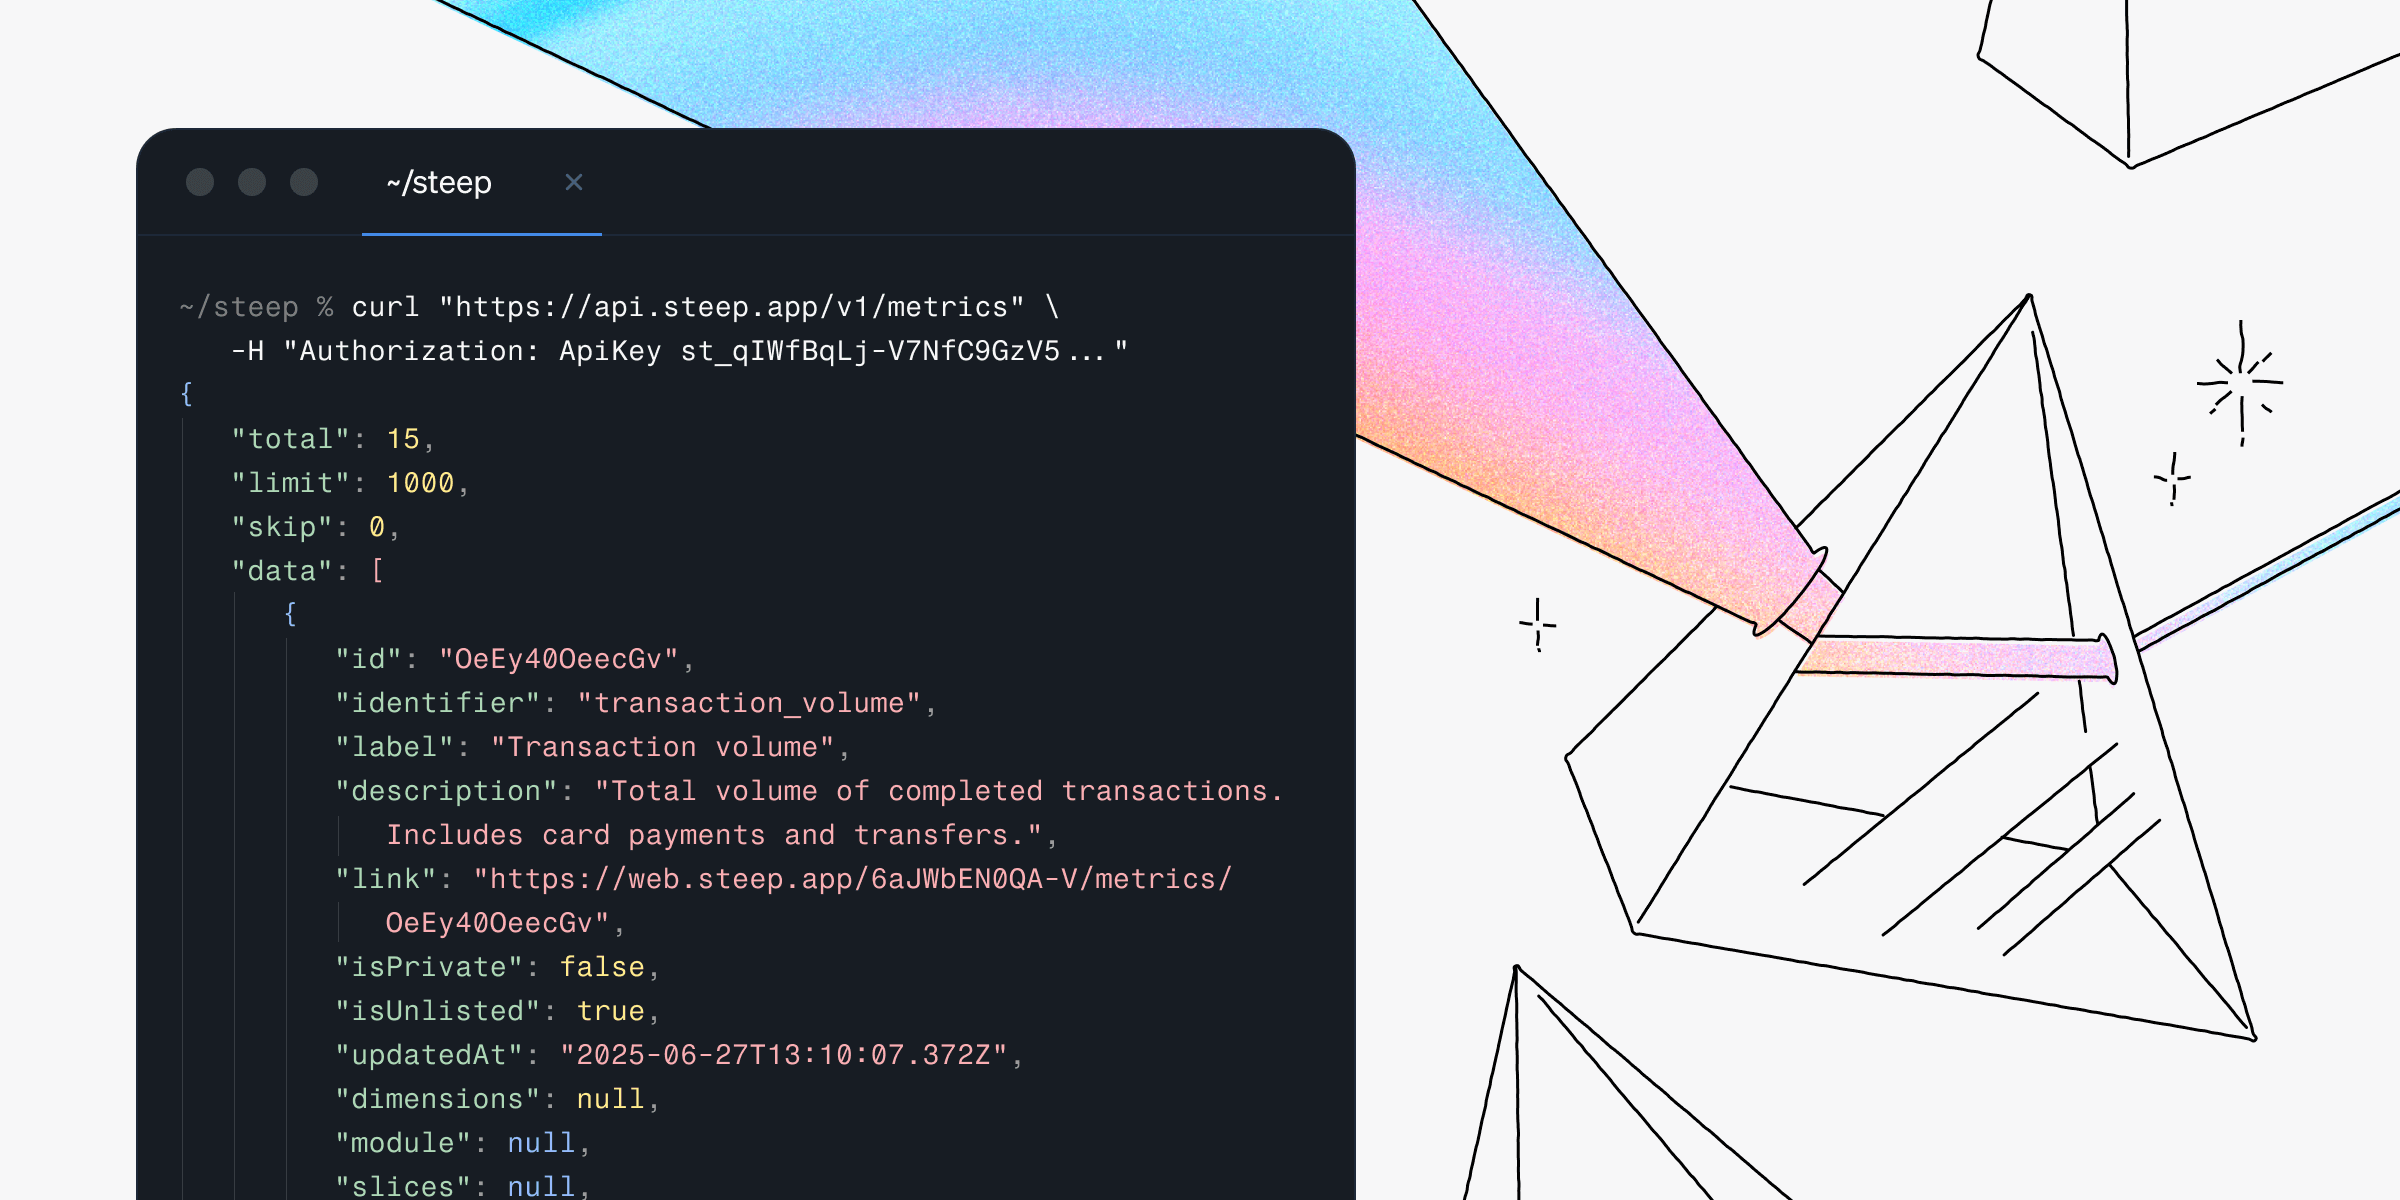
New in Steep: API – Metrics power anything
By Nino Höglund·Product