to explore, analyze and report.
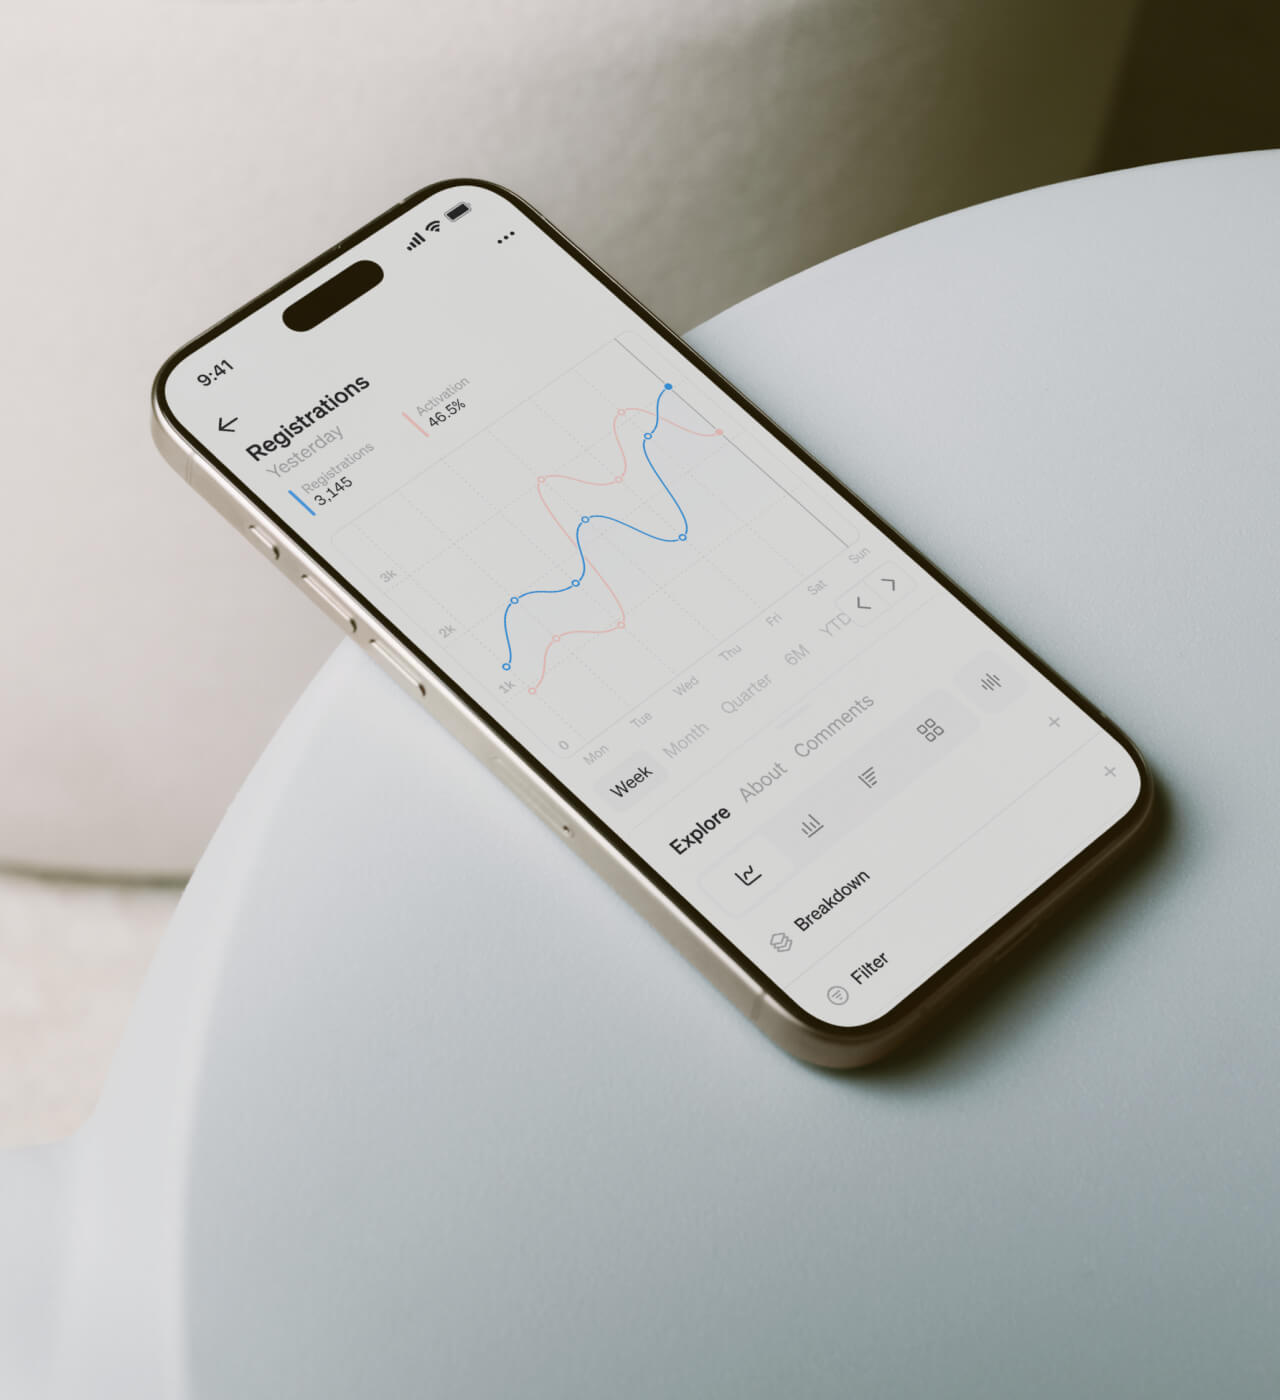
Explore and analyze
Easy to learn.
Deep where it counts.
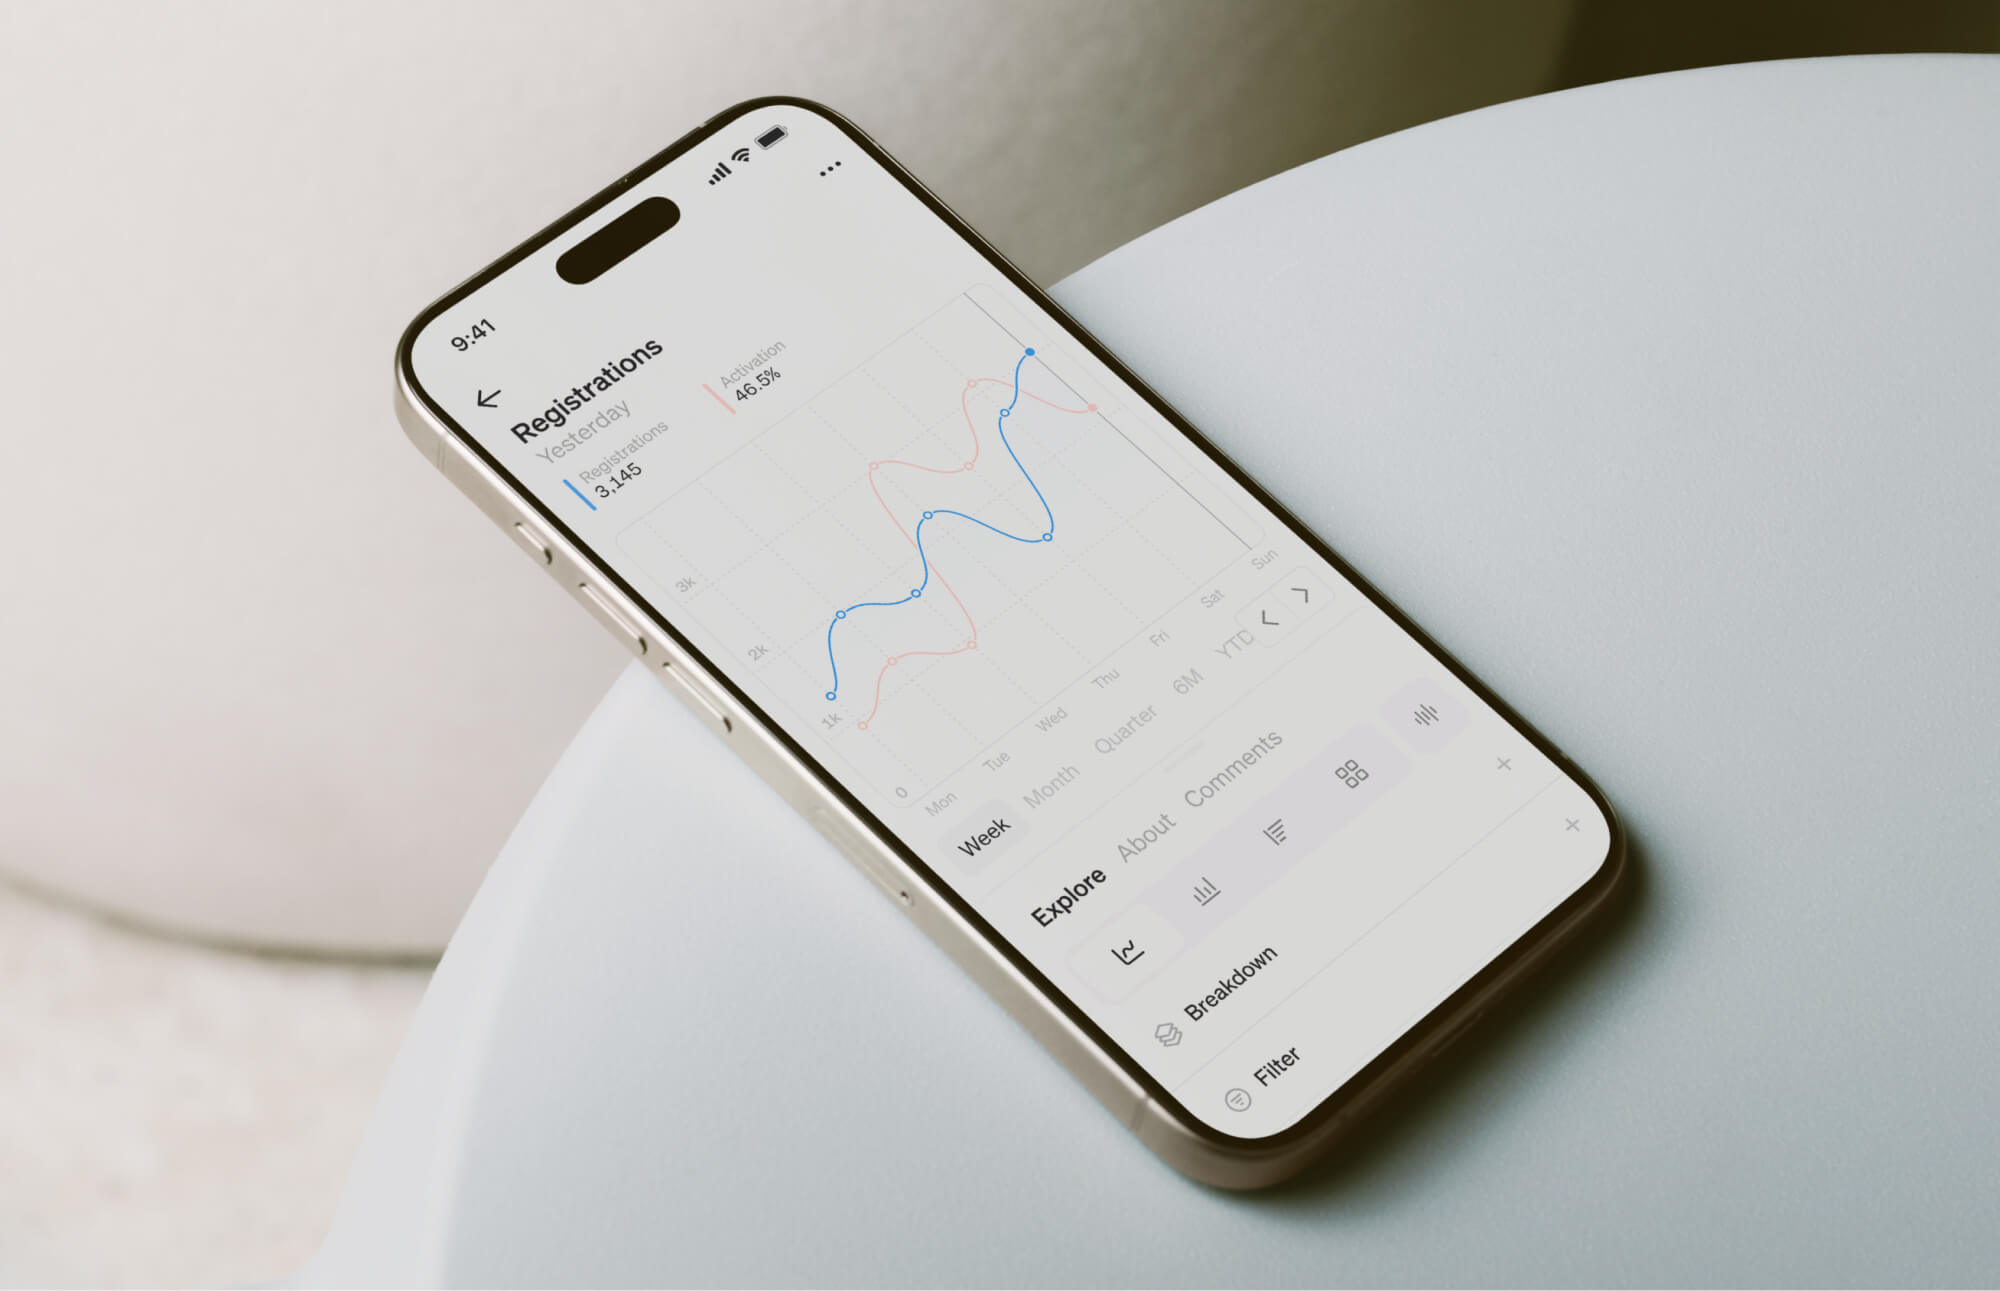
With Steep’s intuitive Explore view, everyone can analyze without analyst support.


Everyone uses the same metrics defined by the data team.

Breakdown metrics by centrally defined dimensions.

With just one click, overlay metrics. previous periods, targets and forecasts.
All numbers can be trusted
Everyone uses the same metrics defined by the data team.
Powerful breakdowns
Breakdown metrics by centrally defined dimensions.
Easy compares
With just one click, overlay metrics. previous periods, targets and forecasts.
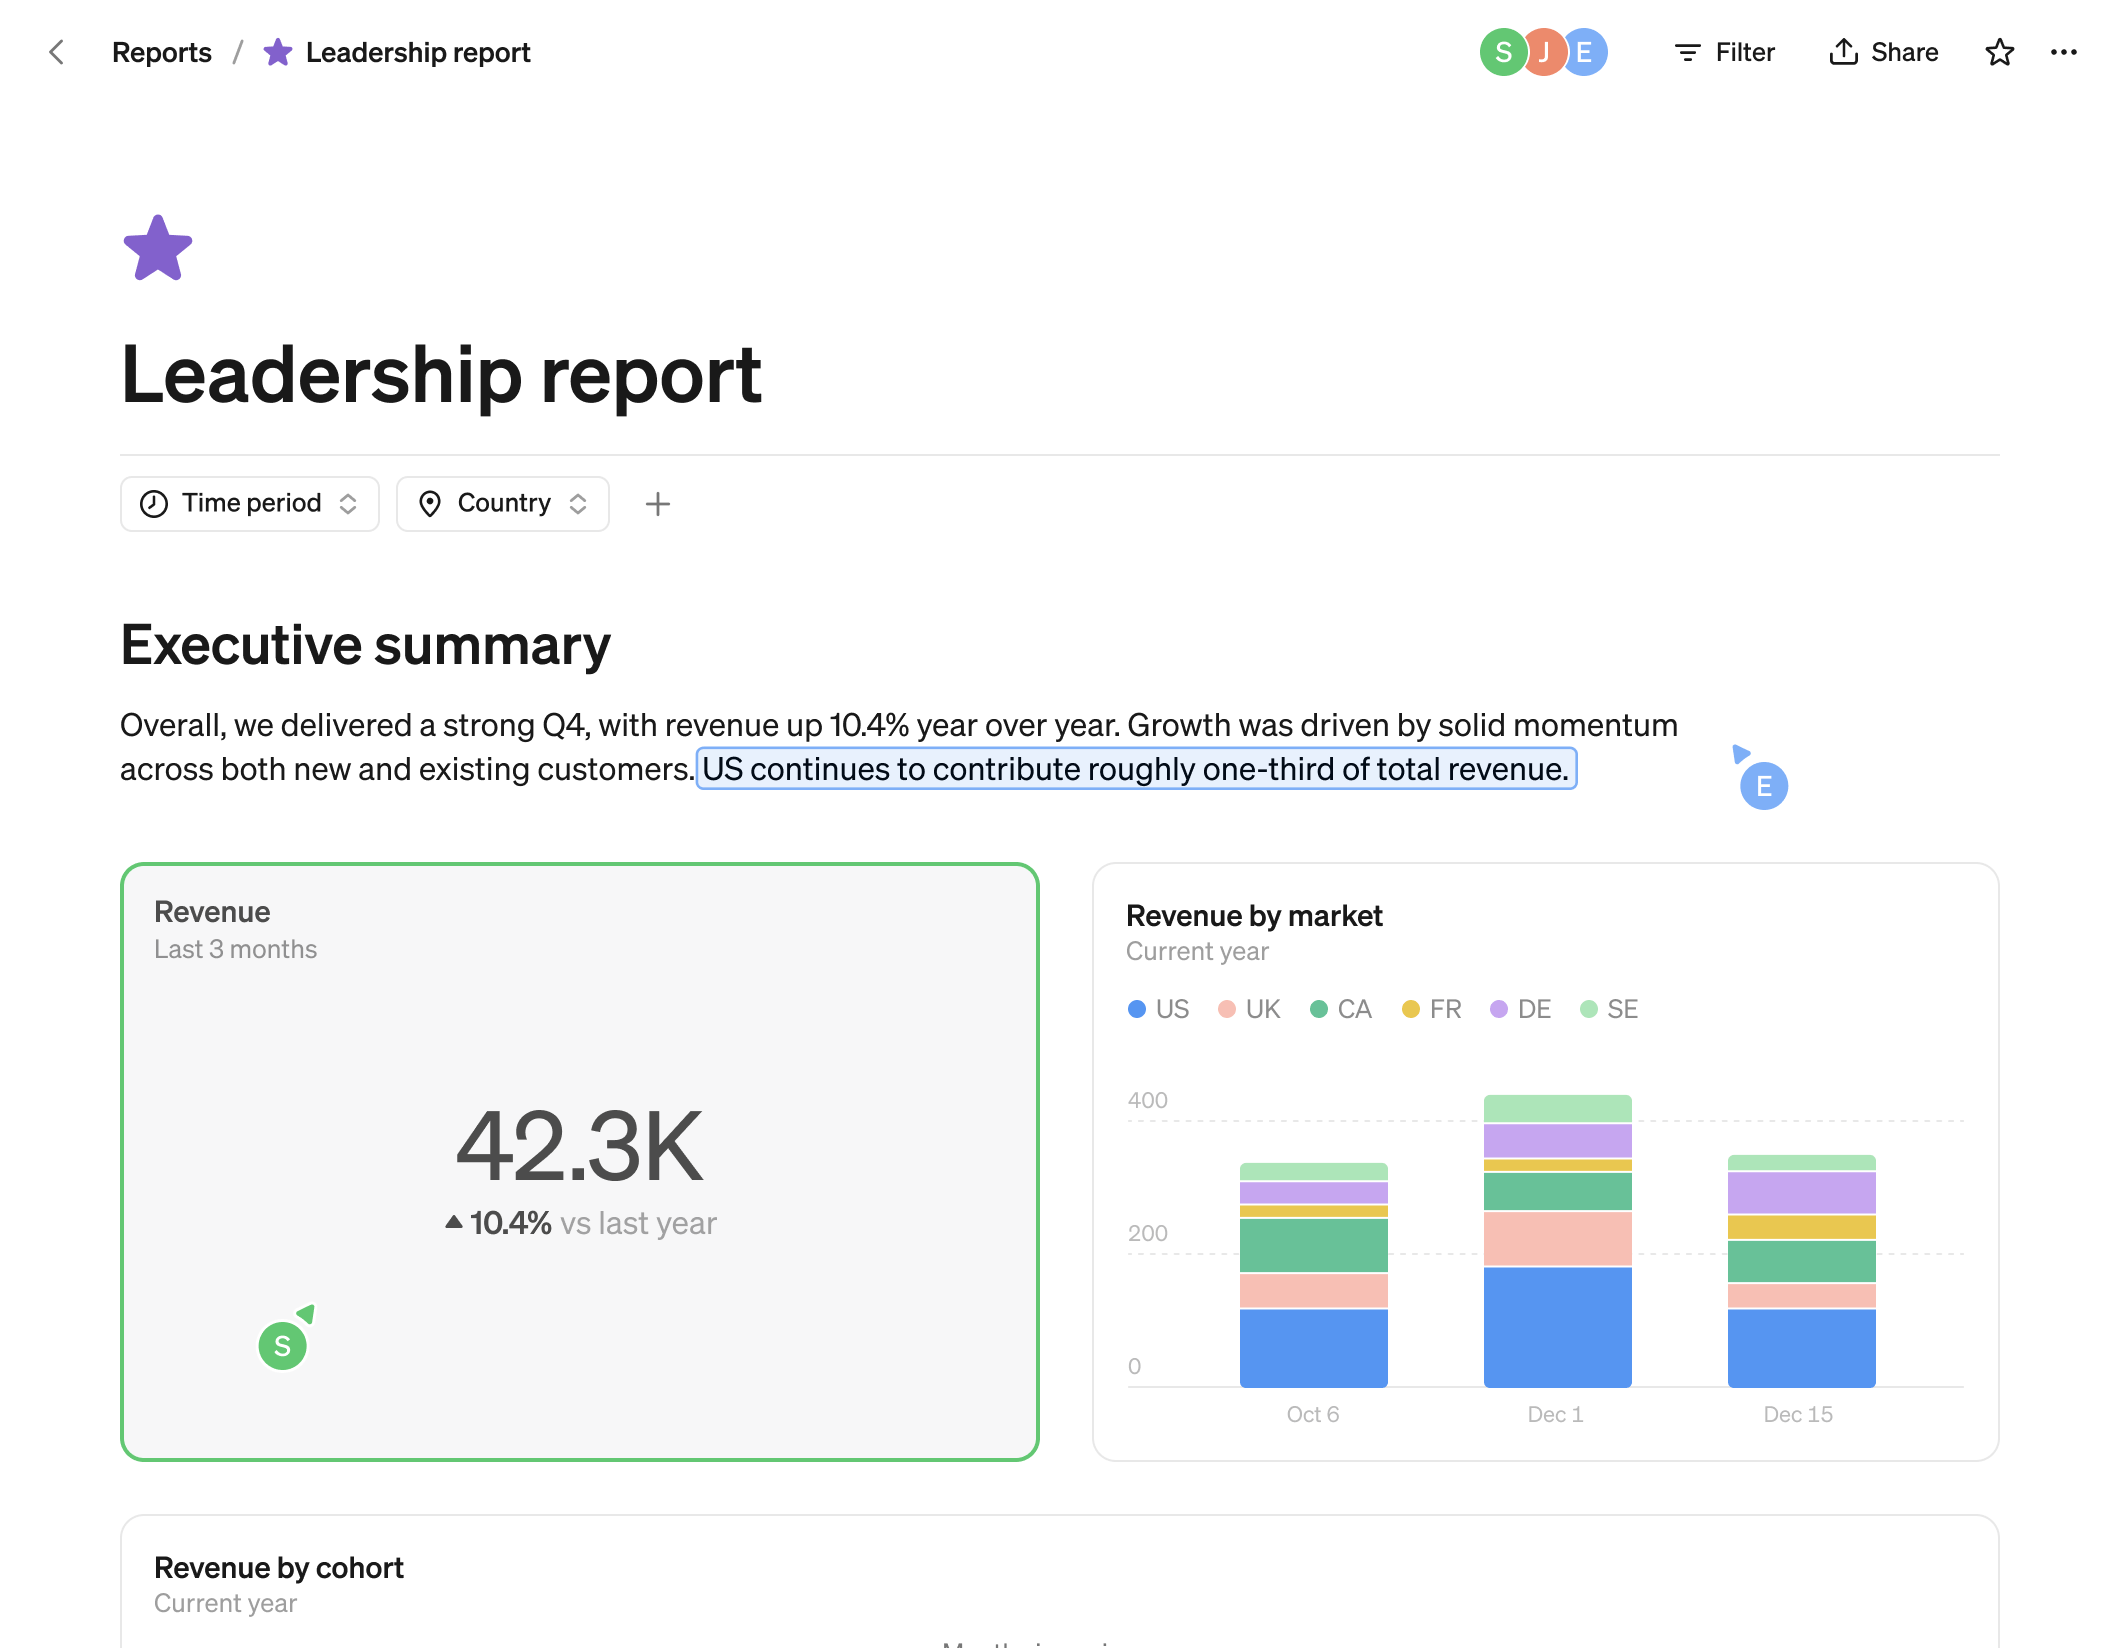
Reports

Create any type of content
From all-hands updates to in-depth driver analysis.

Combine charts, tables, big numbers and text in one dynamic document.

Update the entire report centrally by time period, time grain or dimension.

Automatically deliver reports to Slack channels.
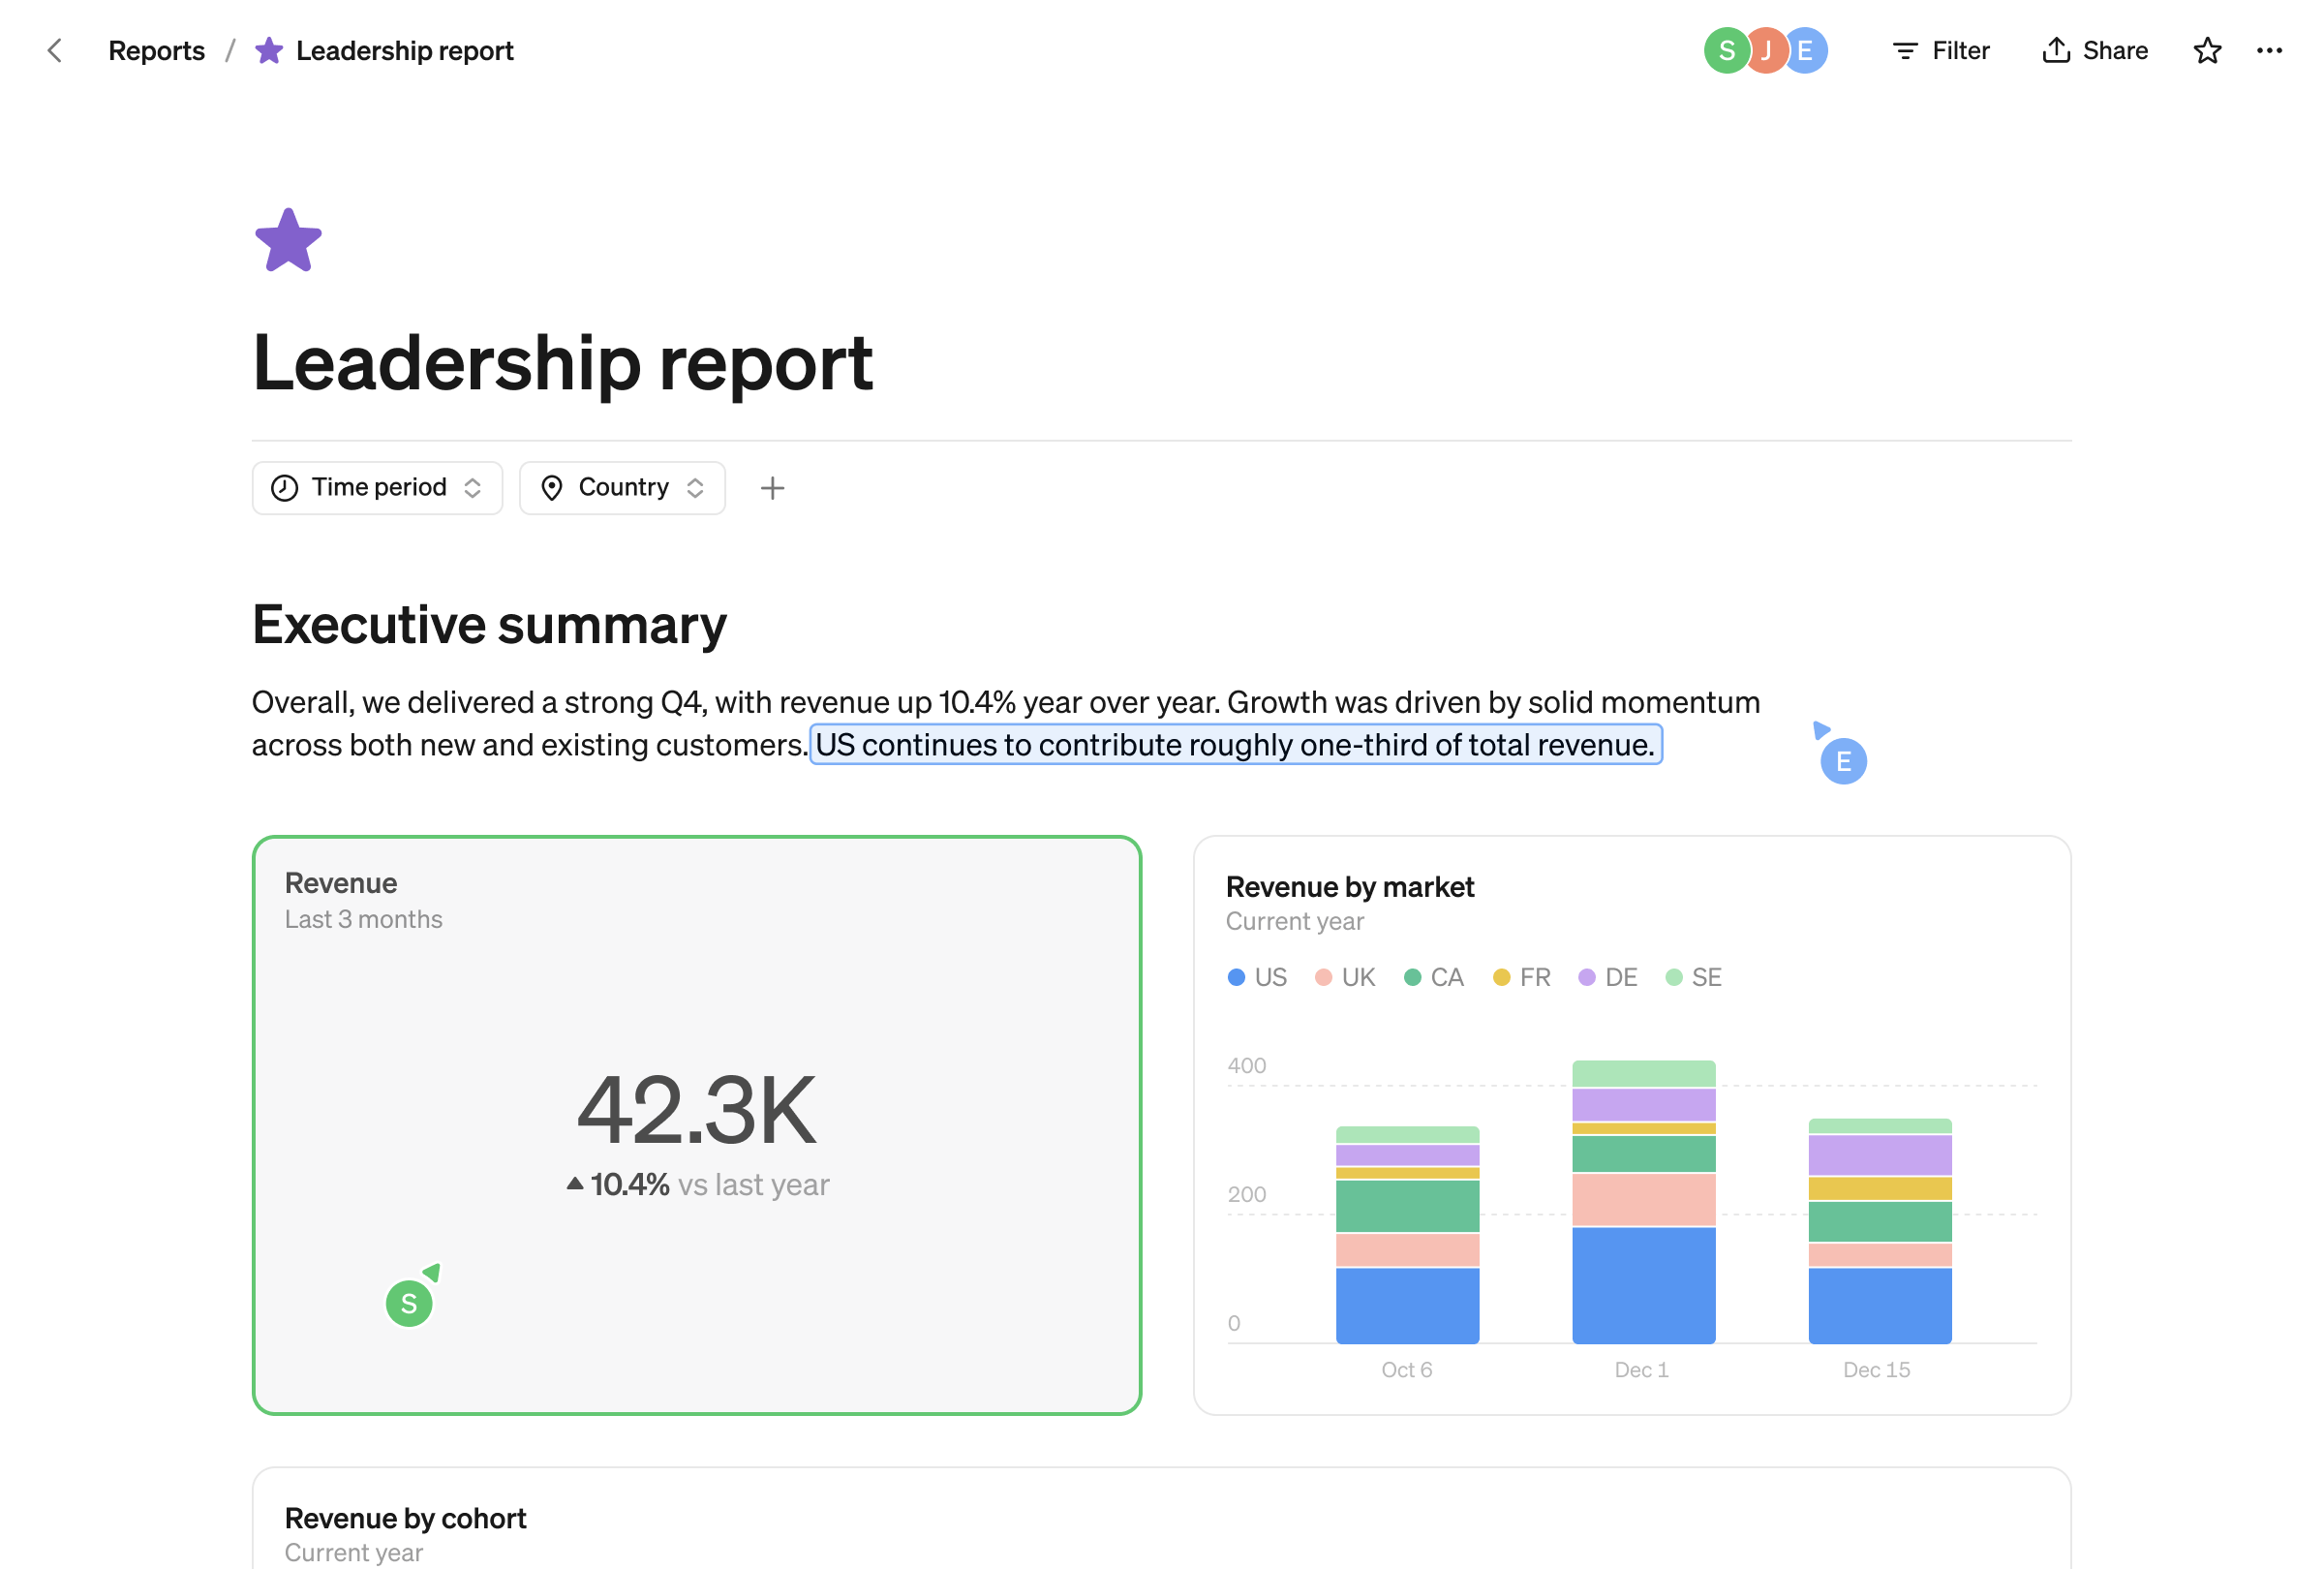
Rich building blocks
Combine charts, tables, big numbers and text in one dynamic document.
Global filters
Update the entire report centrally by time period, time grain or dimension.
Schedule to Slack
Automatically deliver reports to Slack channels.
Entities


Click on any visualization to see the row-level details behind the metric.

Navigate seamlessly to relevant web pages.

Export your filtered and sorted entity list to use anywhere.
Drill down from anywhere
Click on any visualization to see the row-level details behind the metric.
Custom links
Navigate seamlessly to relevant web pages.
Export
Export your filtered and sorted entity list to use anywhere.
Maps
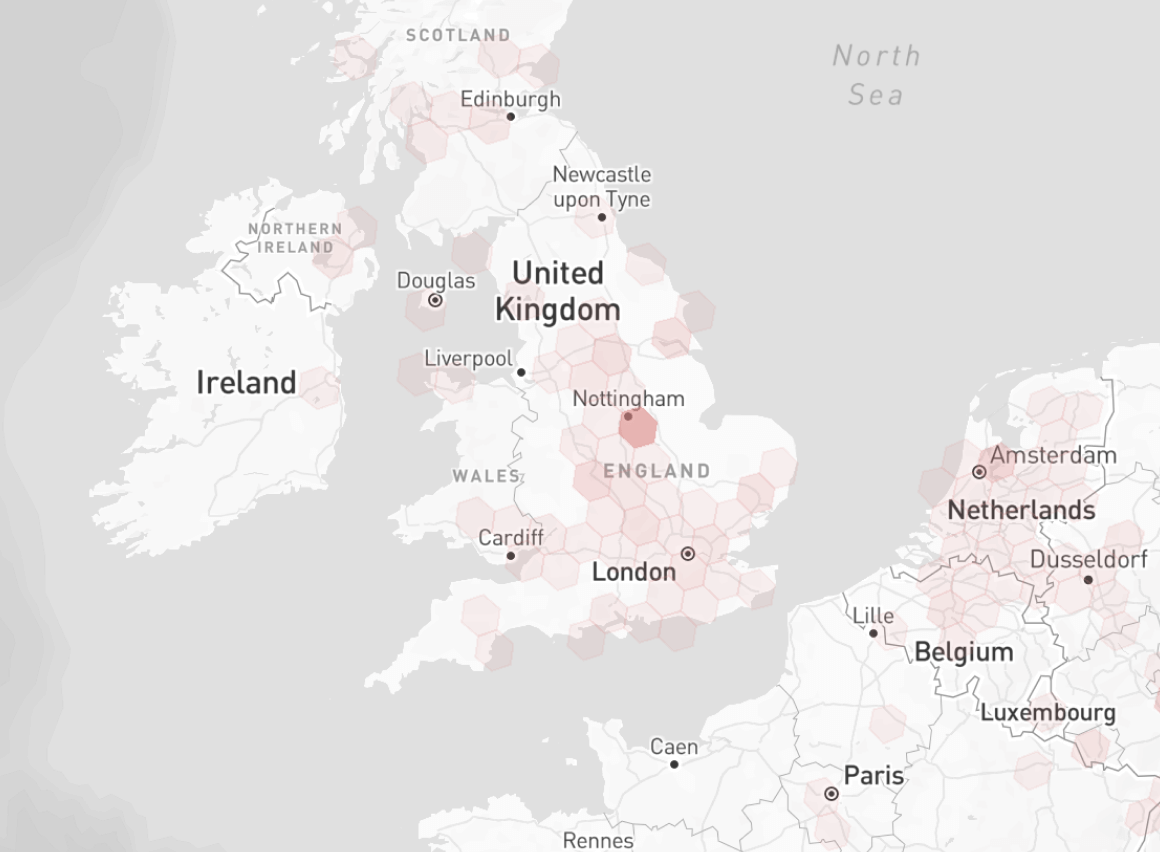
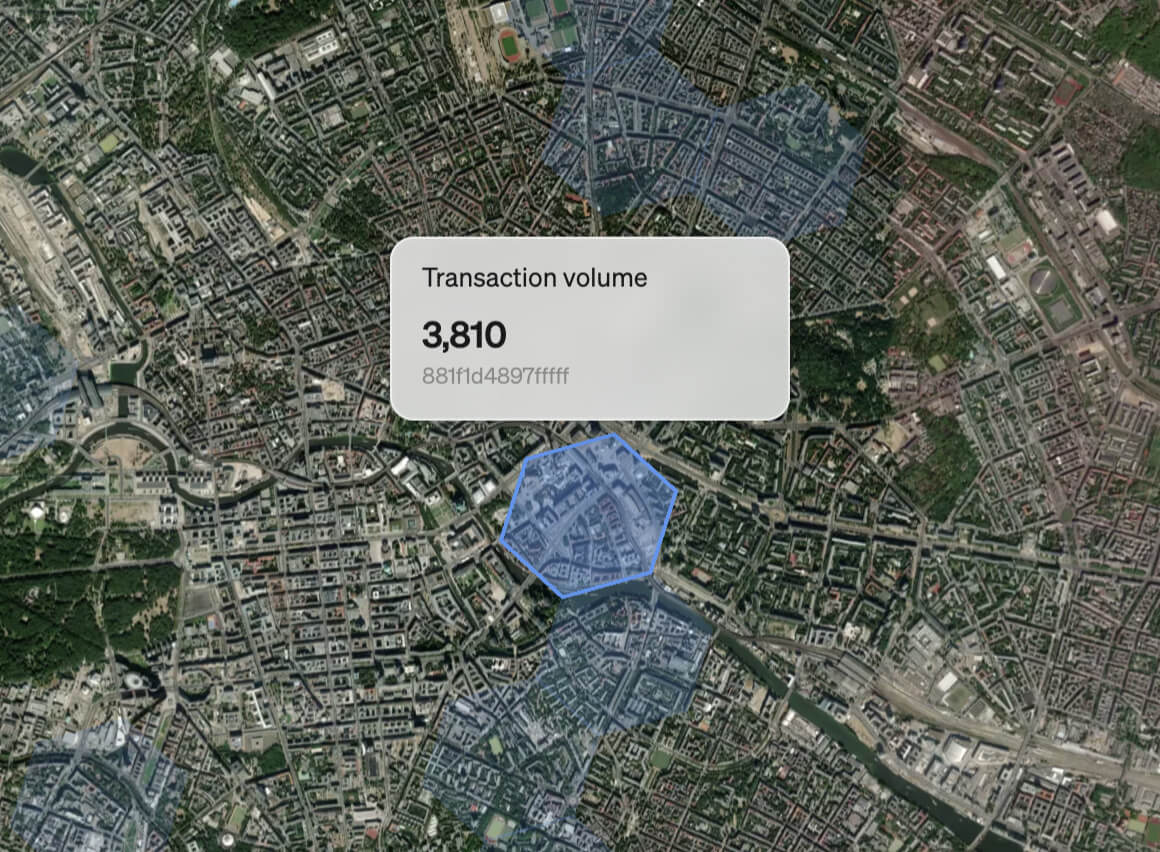
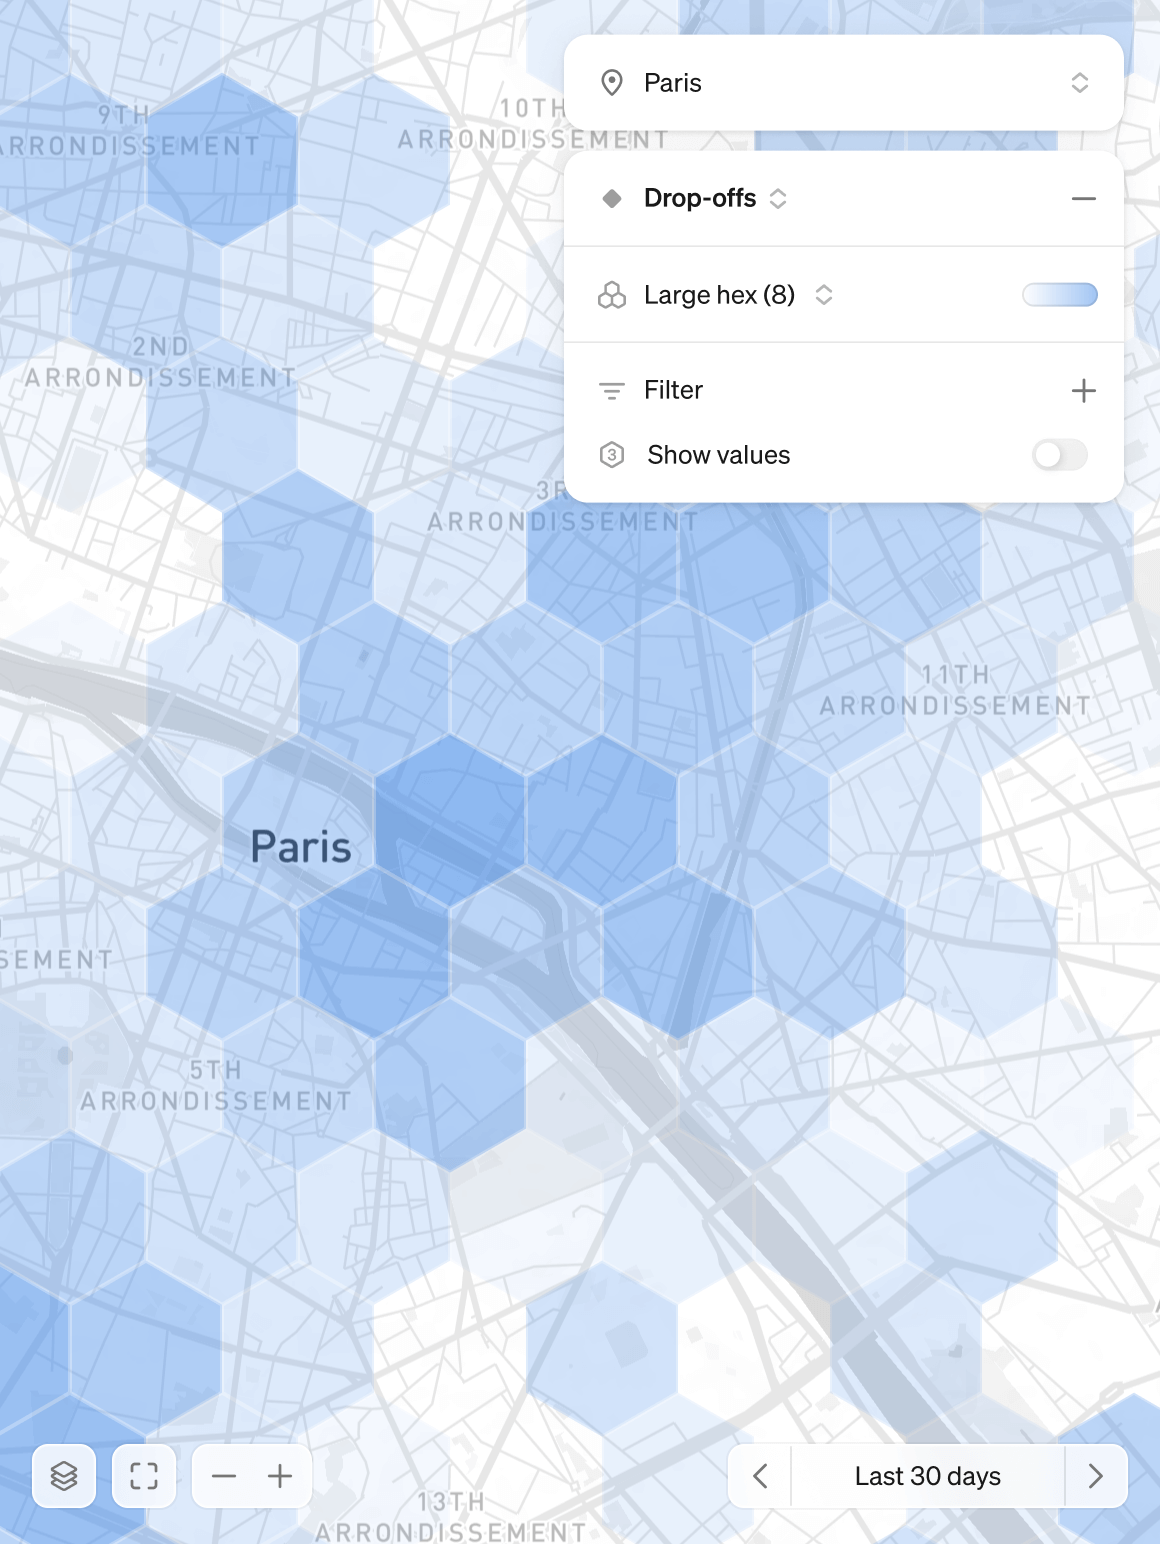
Simple, intuitive, and made to be explored by everyone. Just open the map and dive into your metrics instantly.
Scale with Steep

Lift up key metrics and targets to create alignment.

Customized widgets and content to suit all functions.

Quick access to the things that matter to you.

Analyze, comment and create reports together.
Customized home screen
Lift up key metrics and targets to create alignment.
A space for each team
Customized widgets and content to suit all functions.
Personal favorites
Quick access to the things that matter to you.
Collaborate at scale
Analyze, comment and create reports together.
