Product updates

Follow along with the latest Steep releases and improvements, or grab our RSS feed to stay in the loop.

Entities in the API and MCP

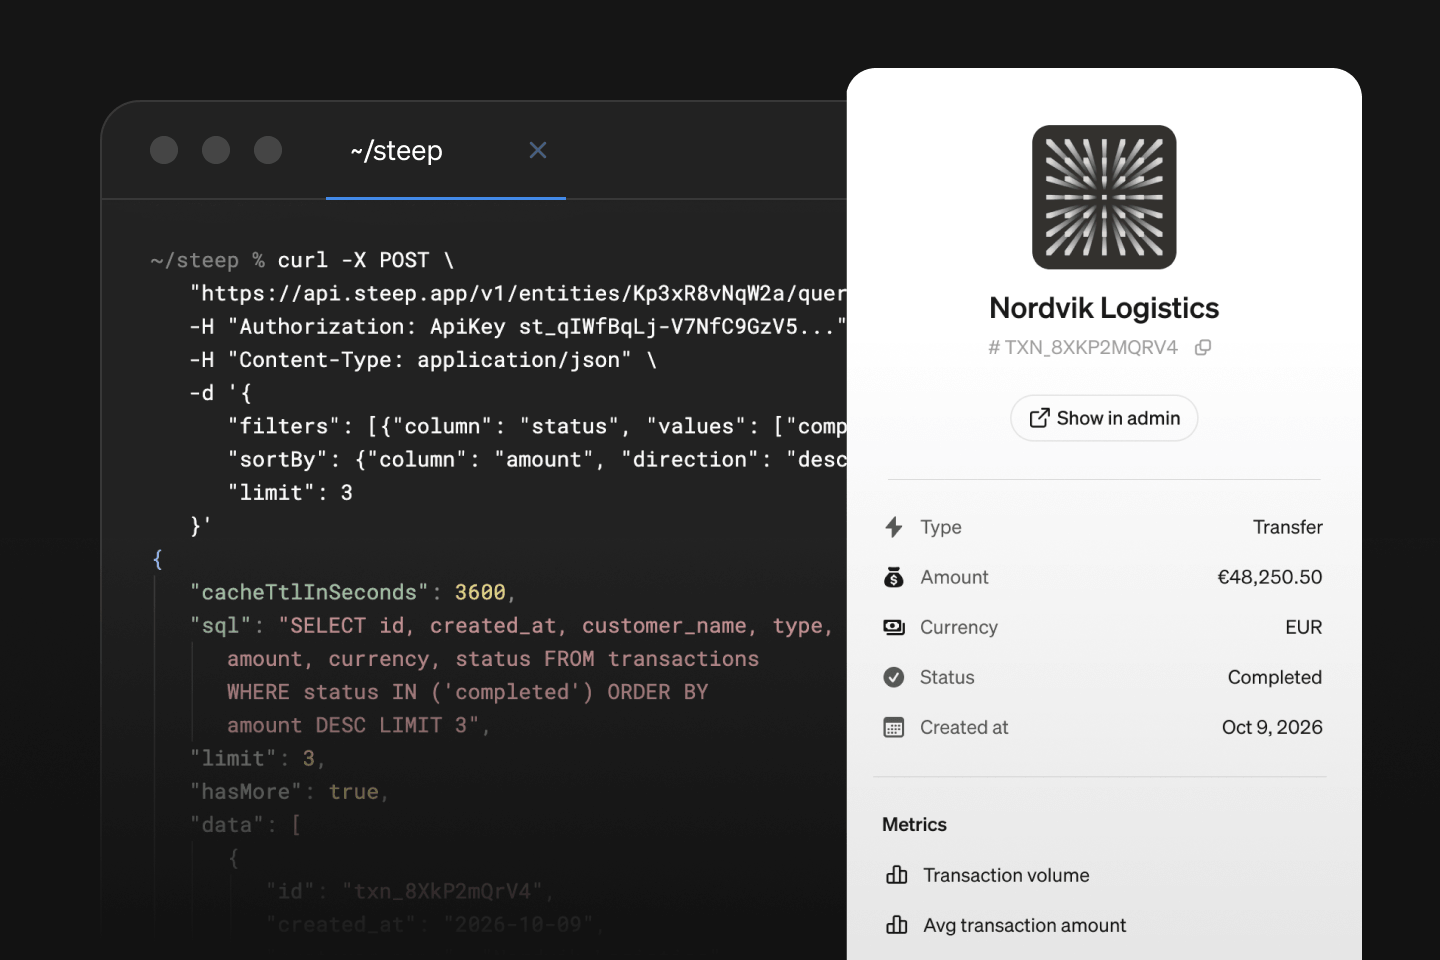
Now you can access row-level data from the Steep API and MCP, so your own tools and agents can work with the individual records behind your metrics, not only the aggregates. Entity definitions work in the MCP right away. Reading entity data requires reauthenticating your MCP connection.

Multiple breakdowns in the API

Query a metric with any number of breakdowns in a single API request, so your custom apps can build visualizations that combine several dimensions at once, without stitching together separate calls.

Help center: API reference →

Sync and preview code changes from the API

Trigger a sync of your semantic models from the API, whether they're defined in Steep as code, dbt, or Cube. The new POST /v1/code/syncs endpoint queues the sync, and you can check its status until it completes or fails.

Add dryRun: true to preview which definitions a sync would create, update or remove, along with any errors or warnings, without changing anything. For Steep as code, include your YAML files in the request to check local changes before pushing them to GitHub.

Help center: API reference →

Instant feedback when working in code

Your Steep YAML files now validate as you type. Add this line to the top of any file, and editors with YAML language server support, like VS Code and Cursor, flag errors and suggest fields in real time:

# yaml-language-server: $schema=https://api.steep.app/v1/code/schema

For stricter checks, point module files to /schema/module and targets files to /schema/targets. See the help center for details.

Help center: Define in code →

Improvements & fixes
  • API The API can now create reports with the new tables
  • API Unrecognized block settings now return an error instead of being ignored
  • OAuth Clearer errors for invalid clients and missing OpenID configuration, and up to 100 redirect URIs per client
October 8, 2026

Images in entities

Images in entities

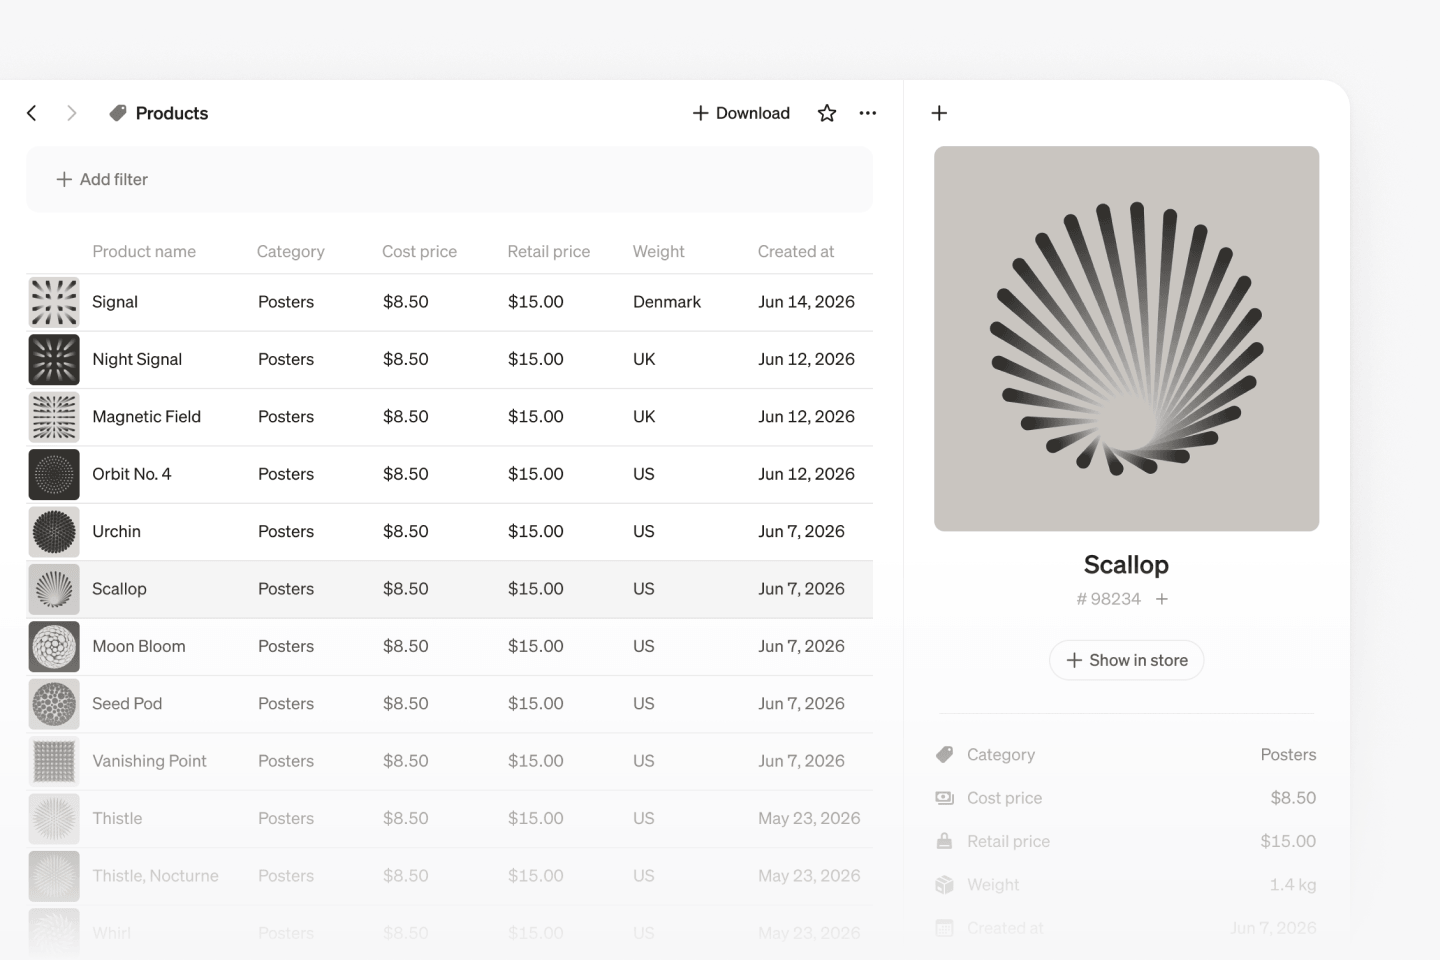
When an entity property holds a link to an image, like a product photo or a logo, Steep now shows the picture instead of the raw link. Thumbnails appear in the entities table, and the side panel shows the first image large at the top. Click it to see it full size. It works automatically for secure image links ending in a standard image file type, with nothing to set up.

Sync colors

Sync colors across a report

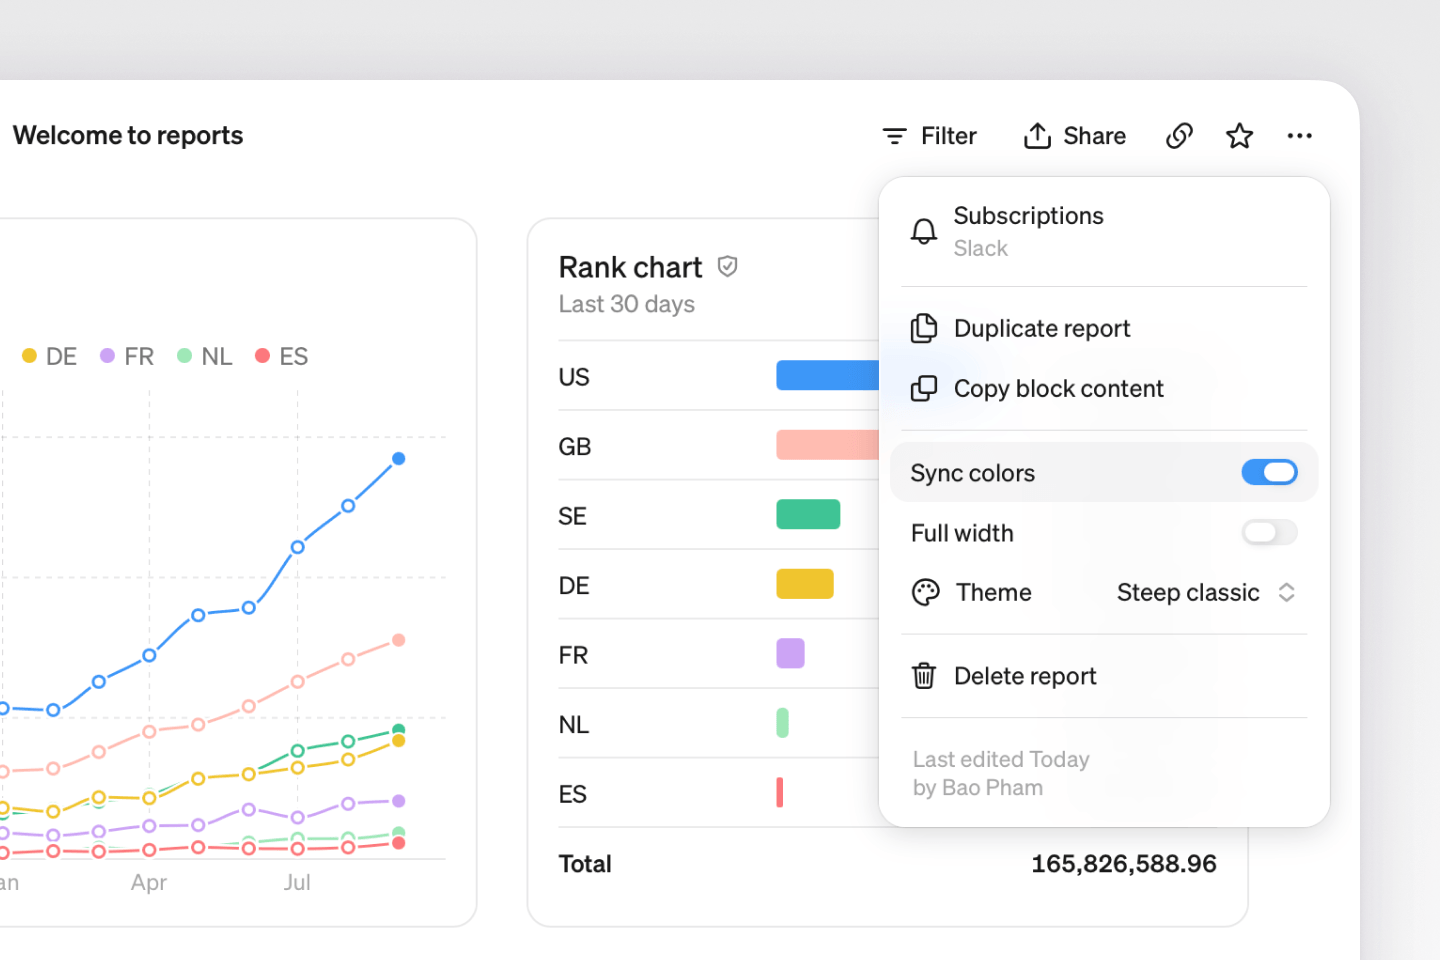
In a report, open the ··· menu in the top-right corner and select Sync colors. Each dimension value then keeps the same color across the whole report, so the same country gets the same color in every chart.

Switch metrics

Switch metrics in place

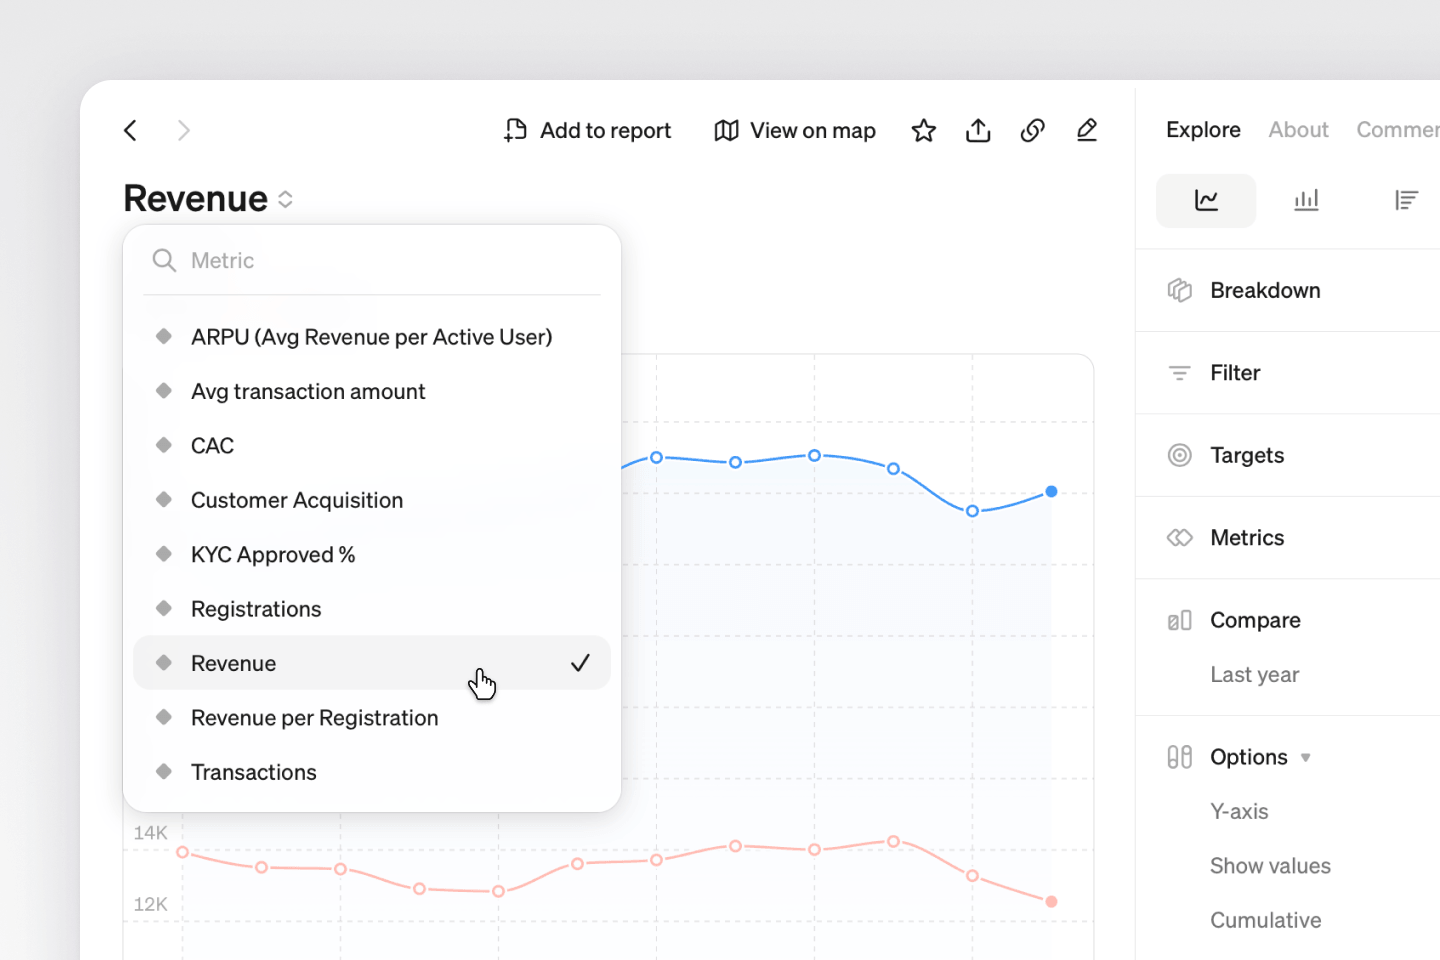
Change the metric directly in explore or a report chart. In explore, click the metric name and pick a new one. In a report, edit the chart, click the metric name in the top-left corner, and choose a new metric. Report charts keep their comparisons and other chart settings when you switch.

Improvements & fixes
  • Settings Now you can drag to reorder the colors when building a custom theme
  • Reports A Copy link button is now in explore, report, and entity headers
  • AI Steep AI can set a report's time period and let individual charts ignore report filters
  • AI Charts from Steep AI no longer come out empty when split by a dimension

September 22, 2026

Tables reimagined

Multiple metrics, multiple breakdowns, comparisons, targets and totals in the same table. Building tables with this much depth has never been easier.

Any number of breakdowns, on both axes

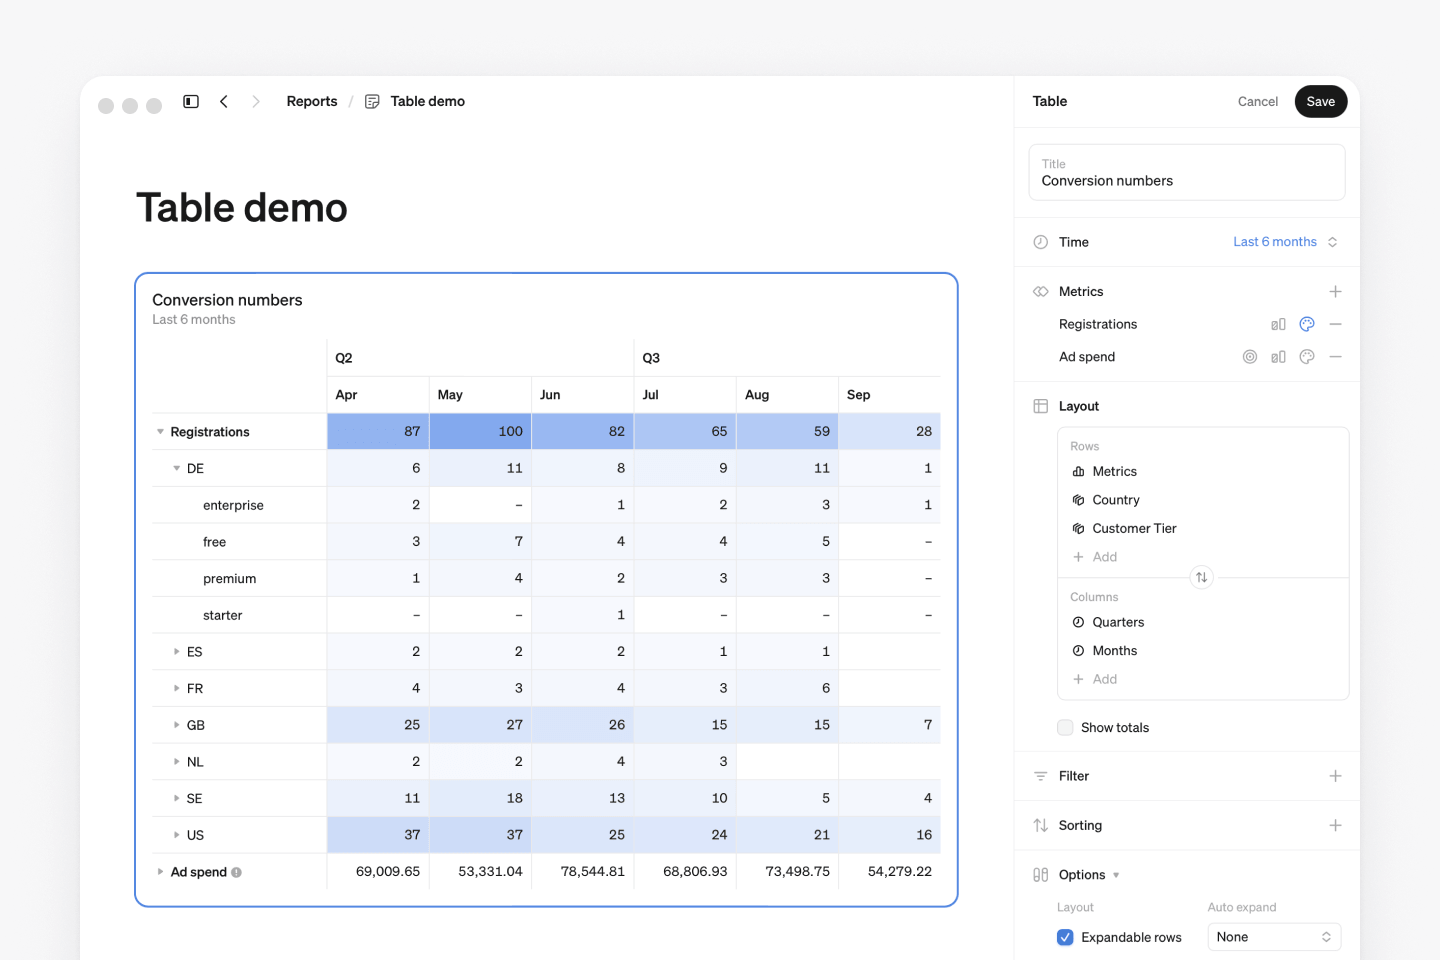
Stack as many breakdowns and time grains as you need, on the rows, the columns, or both. Their order sets the hierarchy, and the transpose icon flips the whole layout at once.

Expandable rows

Switch on Expandable rows and the table groups by your row hierarchy, or leave it off and see every row at once. Click a row to open the level below it and explore as far as the question goes.

Comparisons and targets

Comparisons and targets on every metric

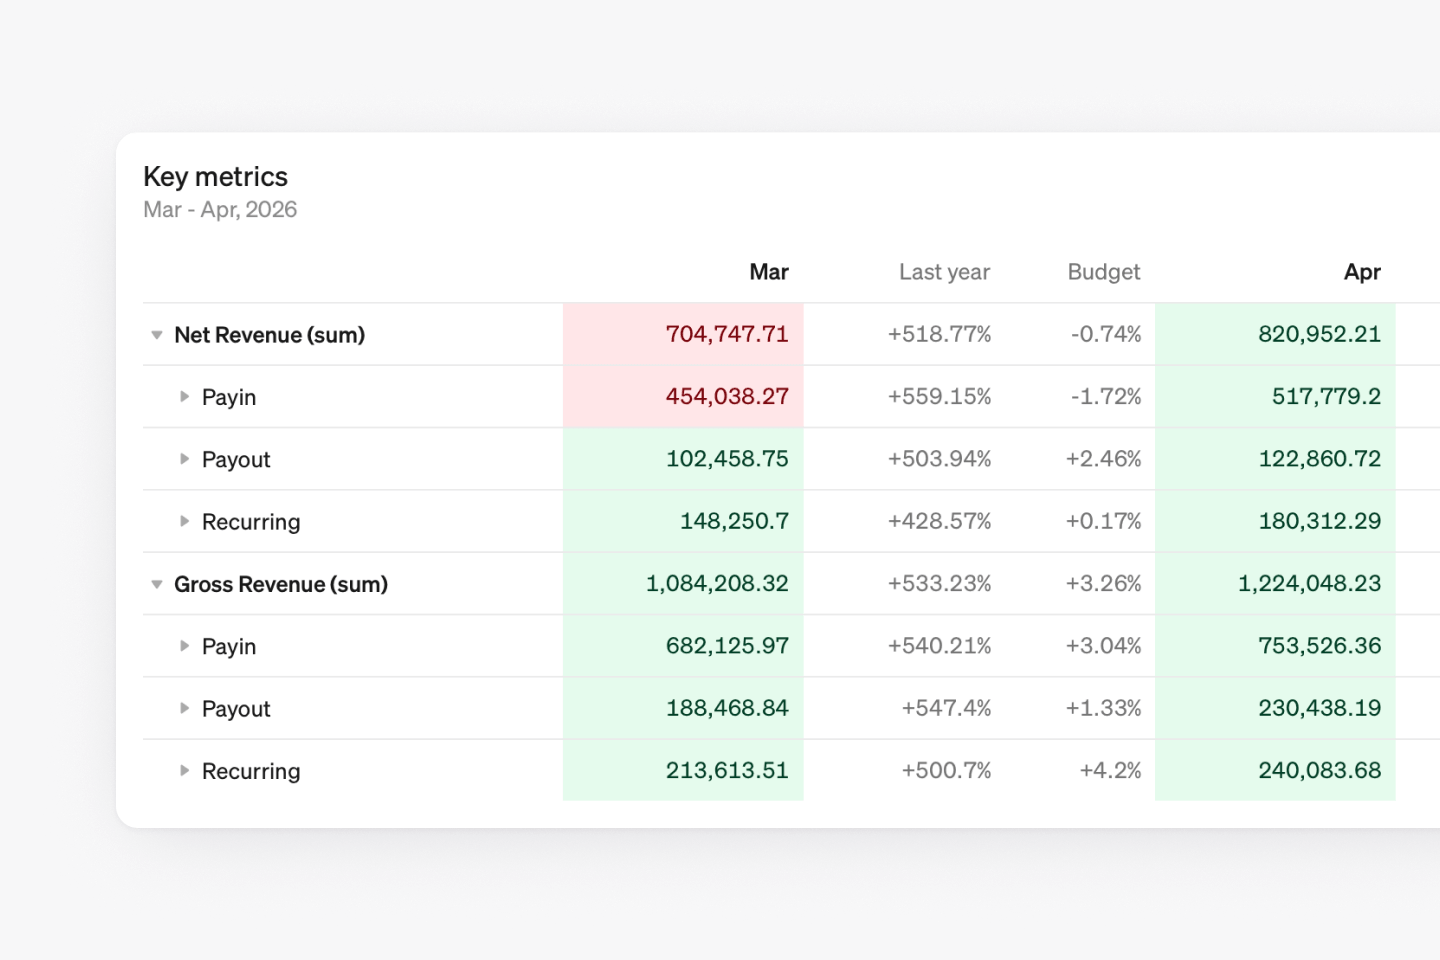
Add a comparison to a metric and change and change in % come with it. Metrics with a target in your semantic model bring the target in with one click, and targets follow the hierarchy all the way down. Show either as rows under each metric, or as columns beside the value they measure against.

Show totals

Switch on Show totals in the Layout section and the table adds a total row, a total column, or both, depending on where your breakdowns sit. Totals only appear where the metric supports them, so nothing gets summed that shouldn't be.

Sorting and Top X filters

Rows and columns sort independently, so you can lead the columns with the most recent month and rank the rows by what happened in it. Limit a breakdown to its biggest values and it applies inside the hierarchy.

And more

  • Long metric and dimension names are handled better
  • Steep AI can create tables for you
  • All table configuration has moved into the edit panel
  • Expandable tables can auto-expand to any level
  • The current row and column highlight on hover
  • Gridlines can be switched on

Tables have been rebuilt from the ground up, with everything set in one edit panel: no SQL, no table calculations, no plugins. If you knew the old tables, everything you could do you still can, and the help center covers what moved where.

Help center: Tables →

September 8, 2026

Color themes

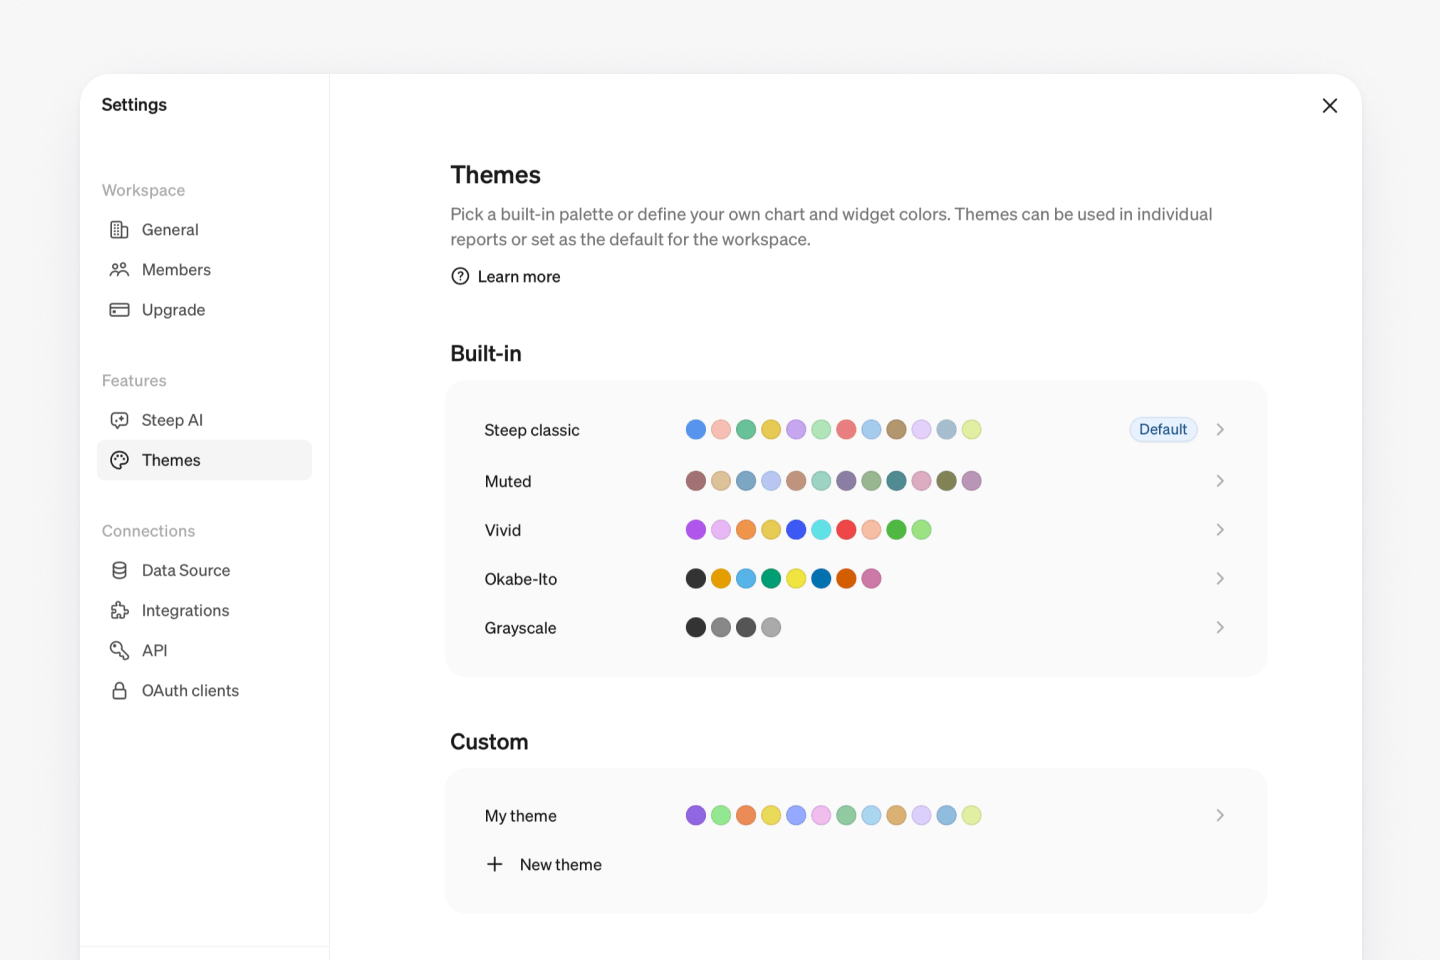
Change the colors in Steep with themes. Choose one of the new built-in themes or create your own custom theme. Themes can be applied to a specific report or set as the default for your entire workspace.

Built-in themes

Five themes are available immediately:

Theme Colors
Steep classic The default, led by Steep blue, with colors across a wide range of hues
Muted Desaturated earth tones
Vivid Saturated colors with strong contrast
Okabe-Ito From the Color Universal Design project, chosen to stay distinguishable for the most common forms of color blindness
Grayscale Shades of gray, which adapt to light and dark mode

Select any of them to preview the colors across the app, then apply it to give your whole workspace a new look.

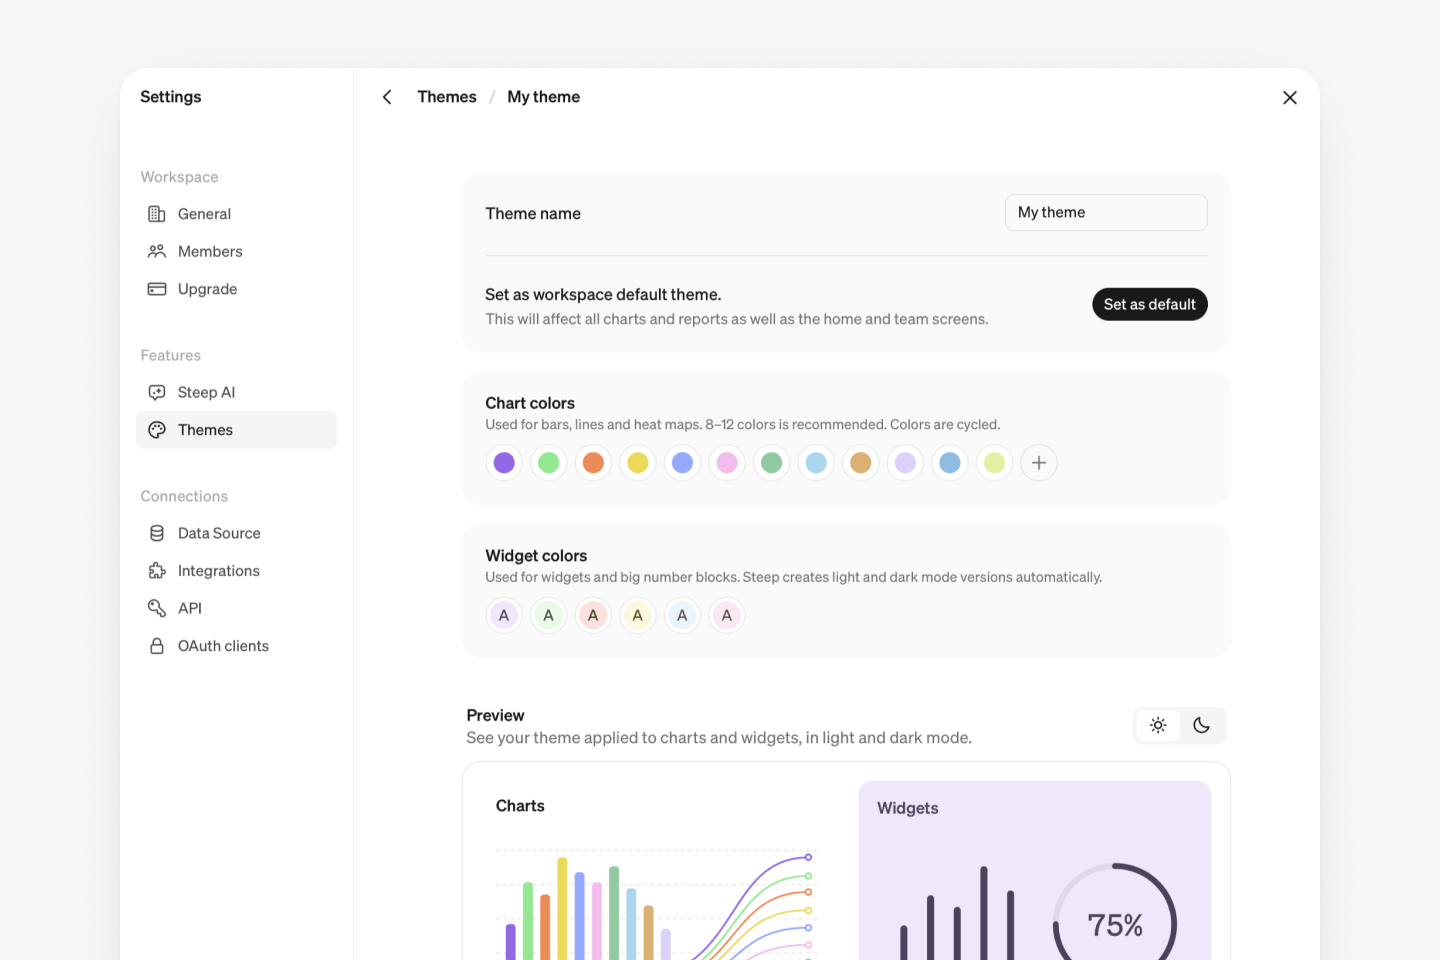
Create a custom theme

Custom themes

Admins can create custom themes with their own chart and widget colors. Pick colors from the picker or paste hex values straight from your brand guidelines, and the preview shows the result in both light and dark mode as you build.

Apply across the workspace, or per report

Set a theme as the workspace default and it's applied everywhere automatically: charts, reports, and the home and team screens. Reports can also carry their own theme, so a report with its own audience can be styled to match. Report editors choose from the themes your admins have saved rather than picking colors themselves, so every report stays inside an approved palette.

Help center: Color Themes →

Add images and files to reports

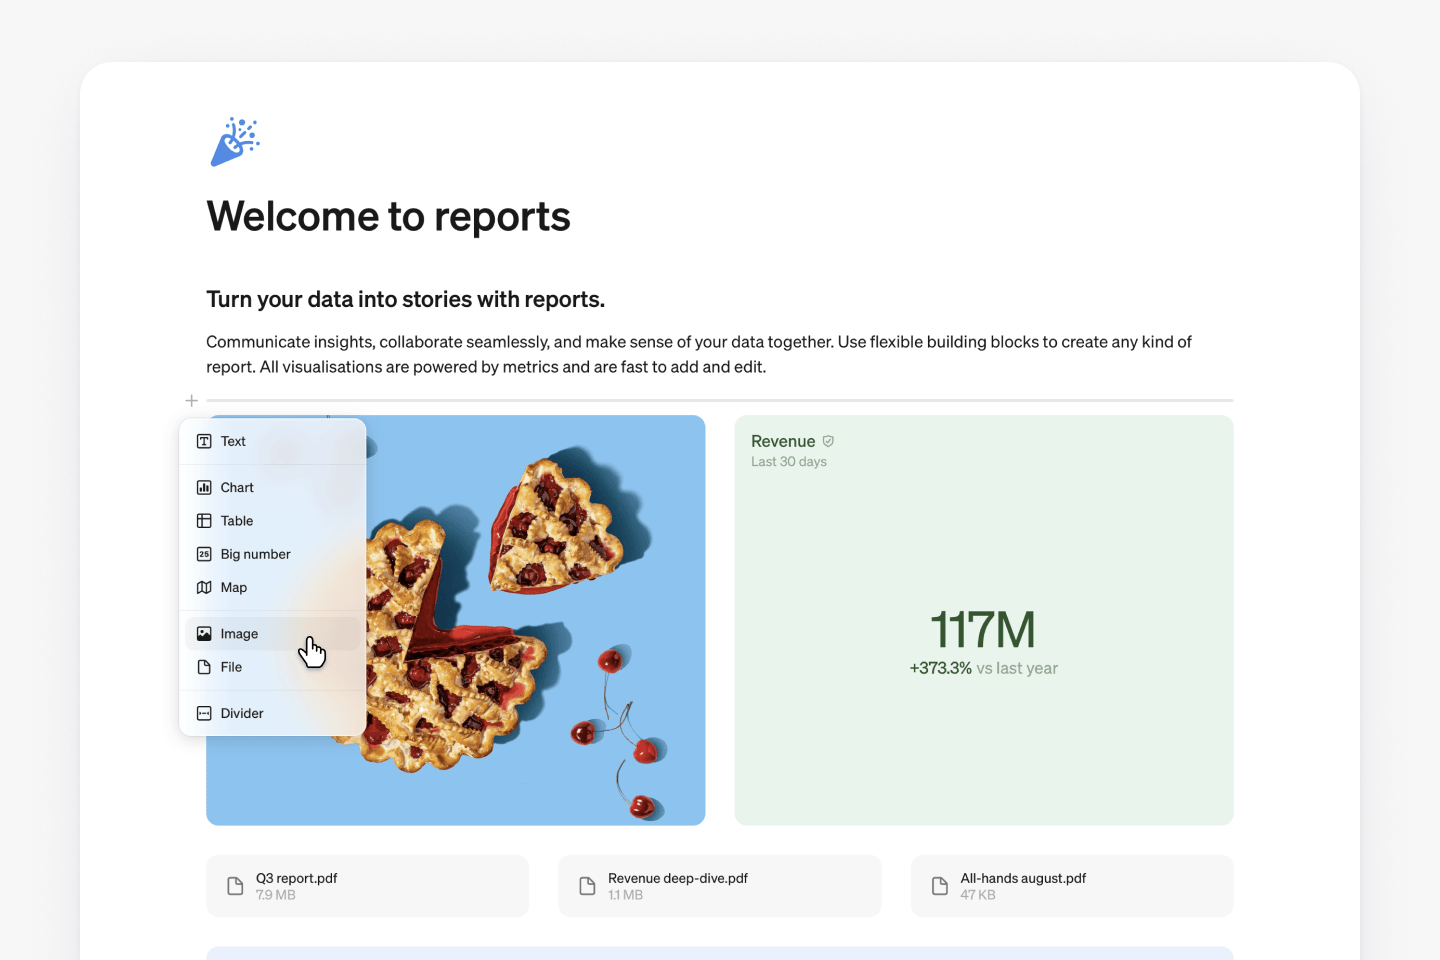
Reports can now hold images and files alongside your existing blocks, so a screenshot, a mockup, or a supporting doc can live right in the report. Files can be dropped in directly or added as a block, and image blocks open full screen with the option to download. Free plans are capped at 10 MB per file; paid plans have no limit.

Upload files to Steep AI

You can now add images, PDFs, and text files as context for Steep AI, dropped in directly or added from the + button, one at a time or several together. Available on the United States model.

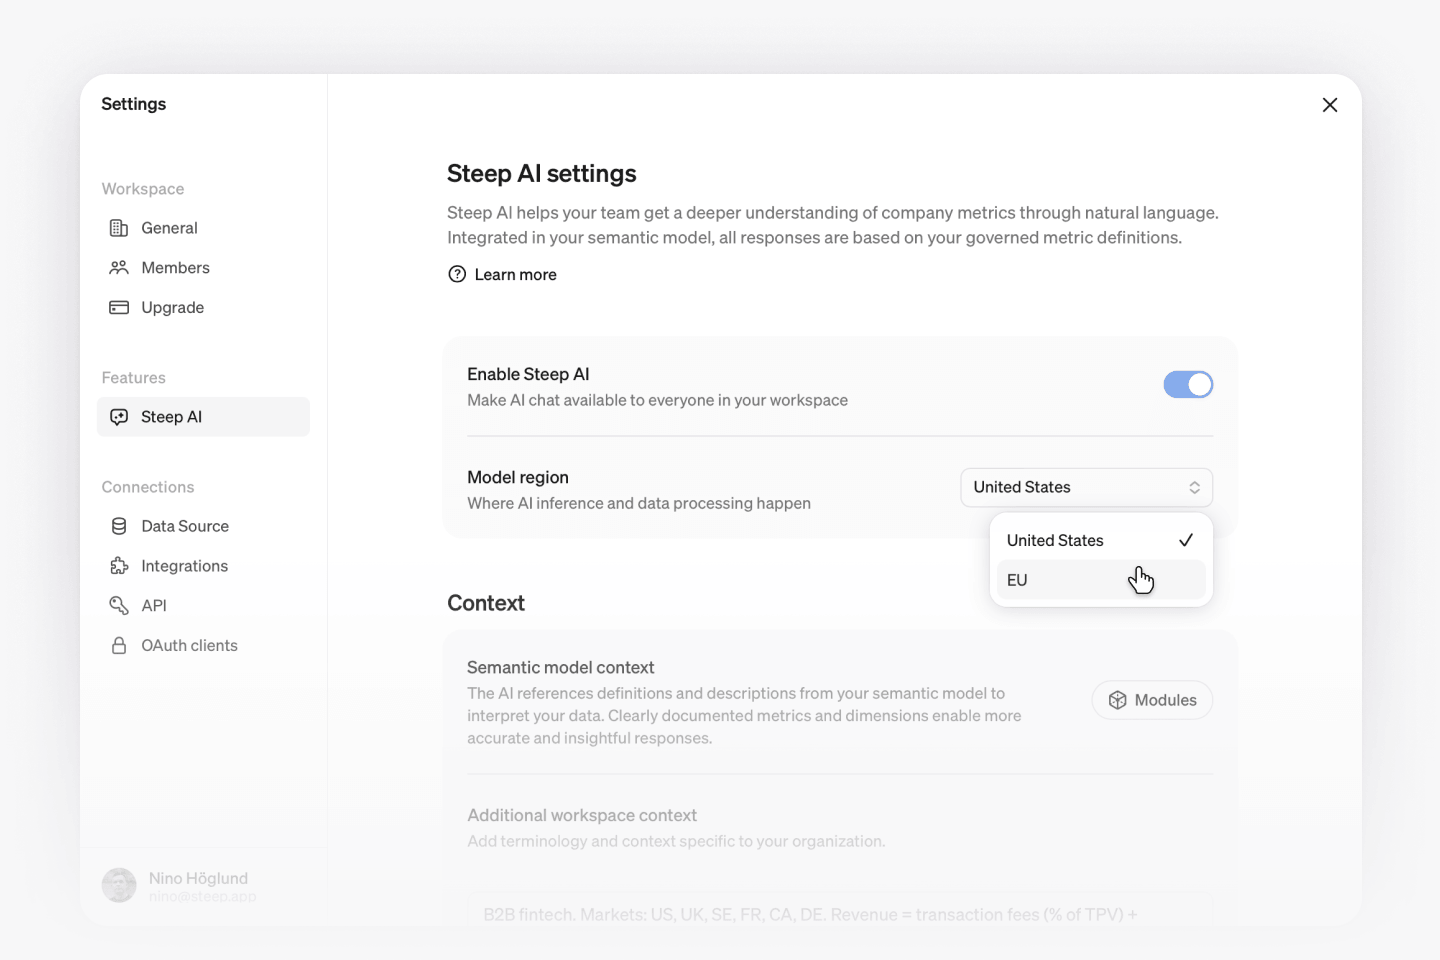
Choose your AI model region

Choose your AI model region

Workspaces can now choose where their AI processing runs, United States or EU, and can update this at any time. The model itself is the same regardless of location.