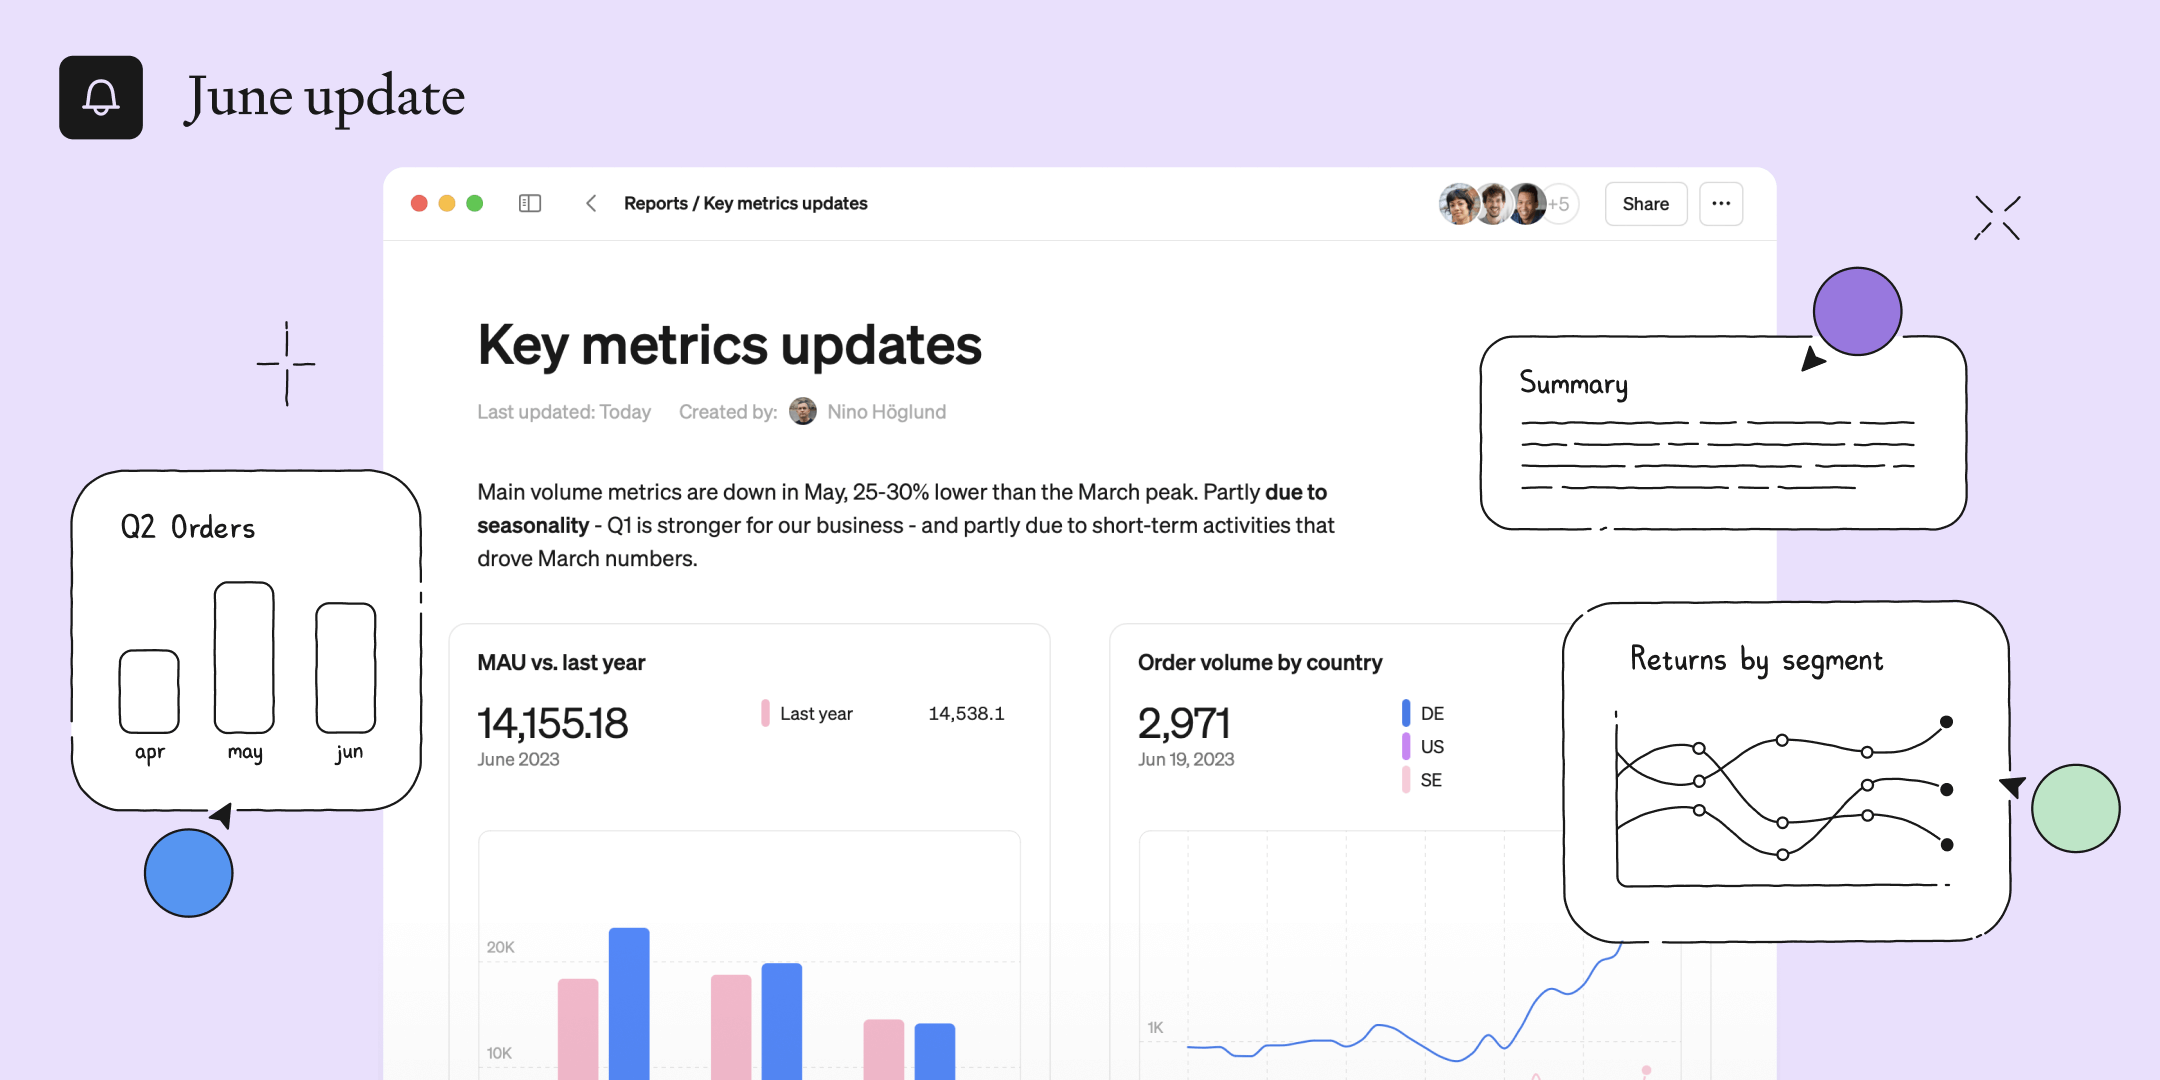
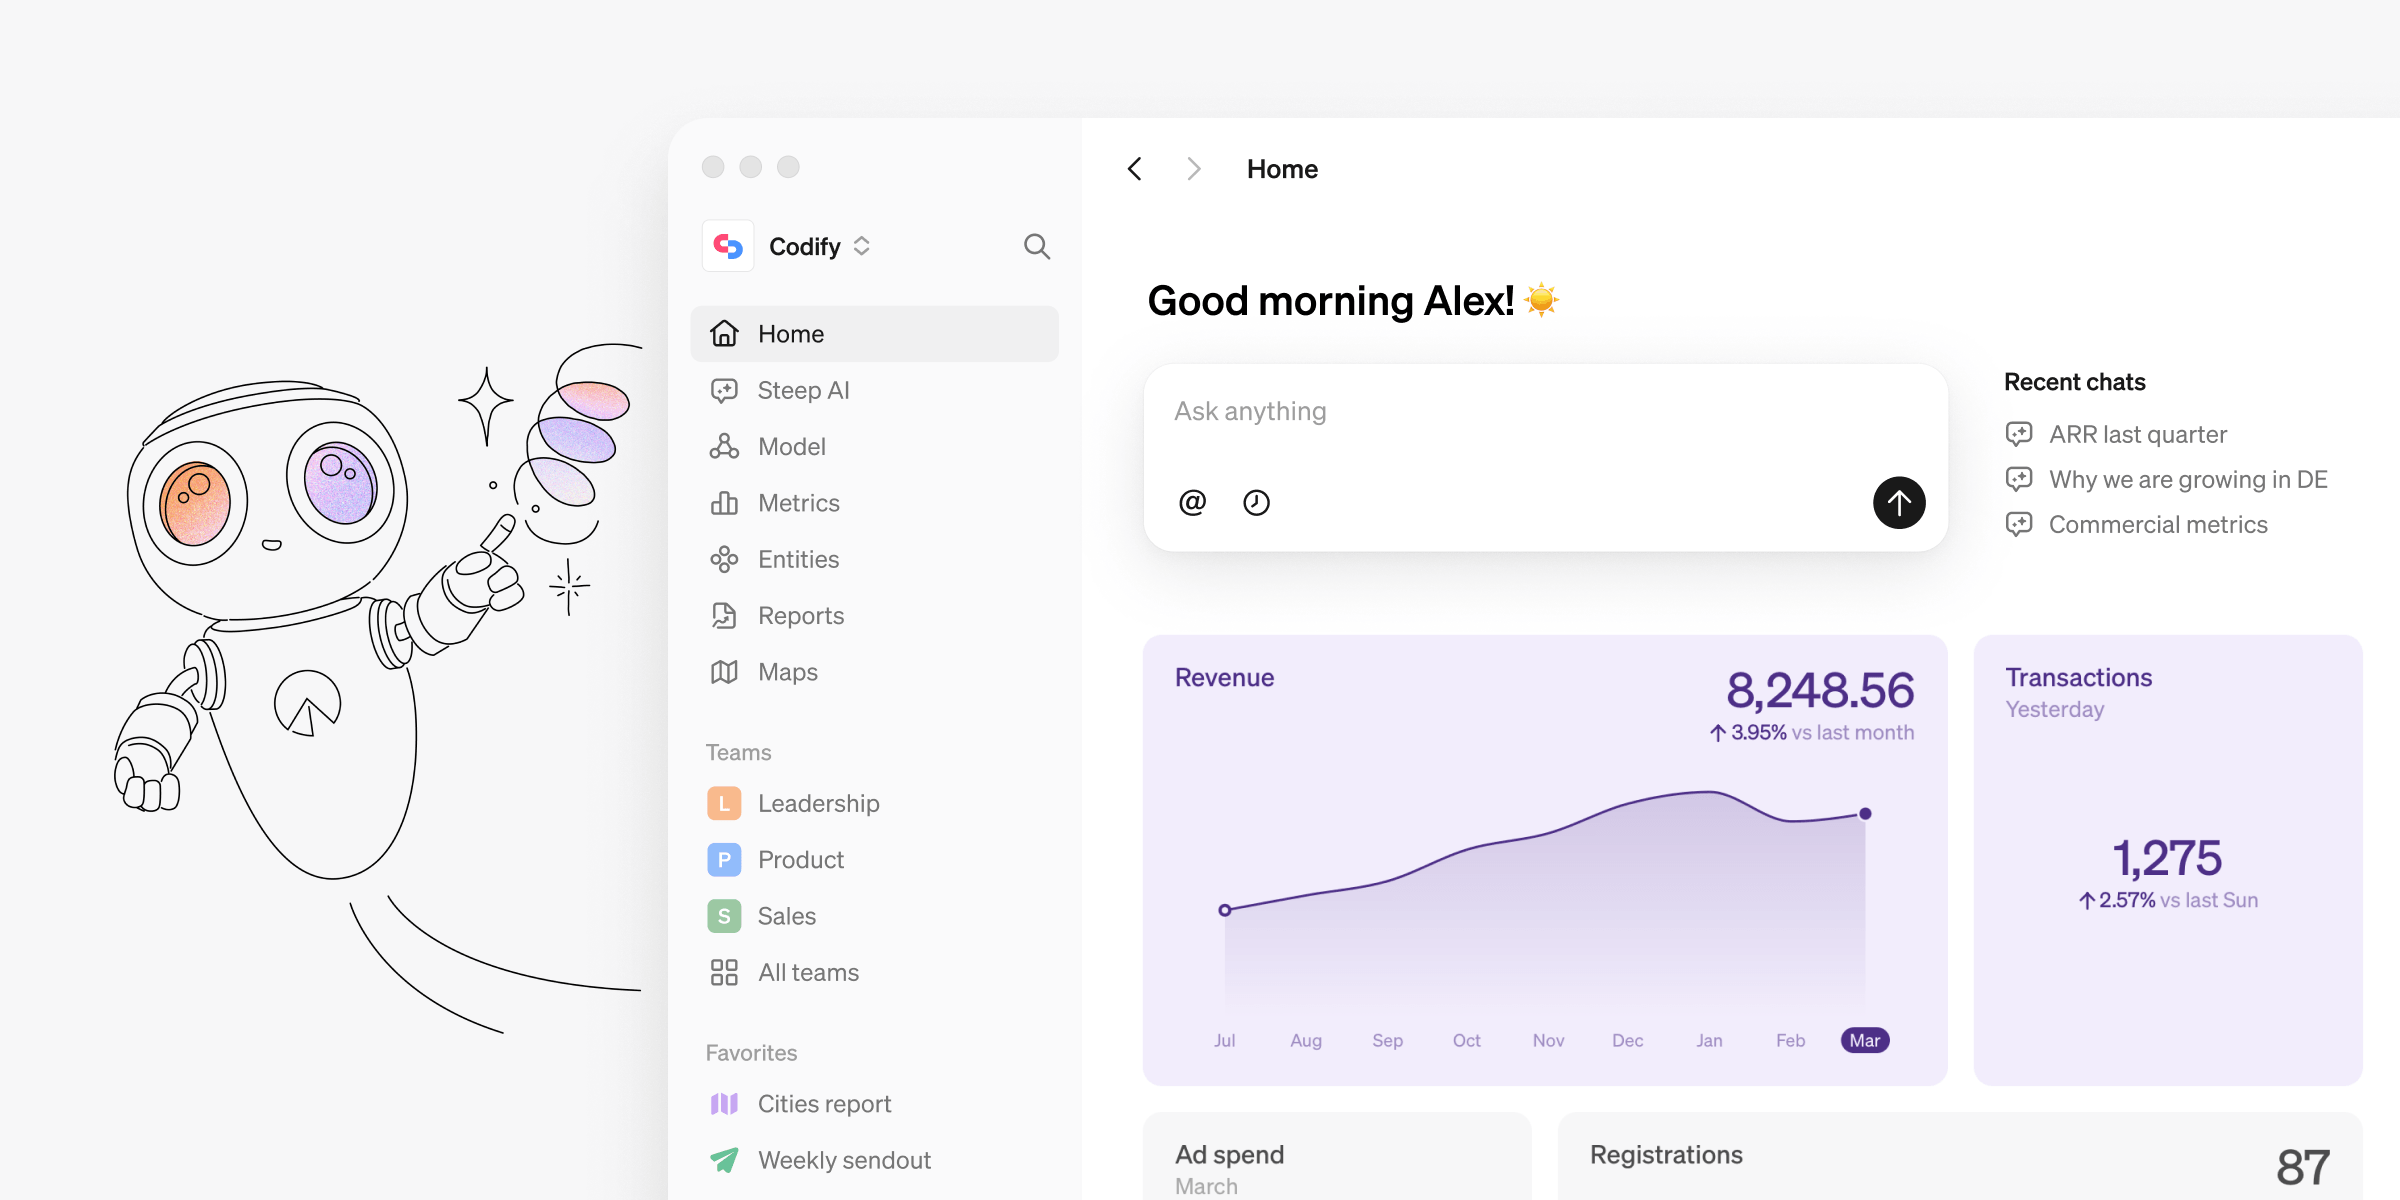
This month we are bringing you a whole new way to create, collaborate and communicate with data - introducing the new Reports.

Turn your data into stories with reports
Communicate insights, collaborate seamlessly, and make sense of your data together. Use flexible building blocks, like charts and text, to create any kind of document. All charts are powered by metrics and are fast to add and edit.
It’s reports reimagined. Head over to the new reports section in the app and start creating.
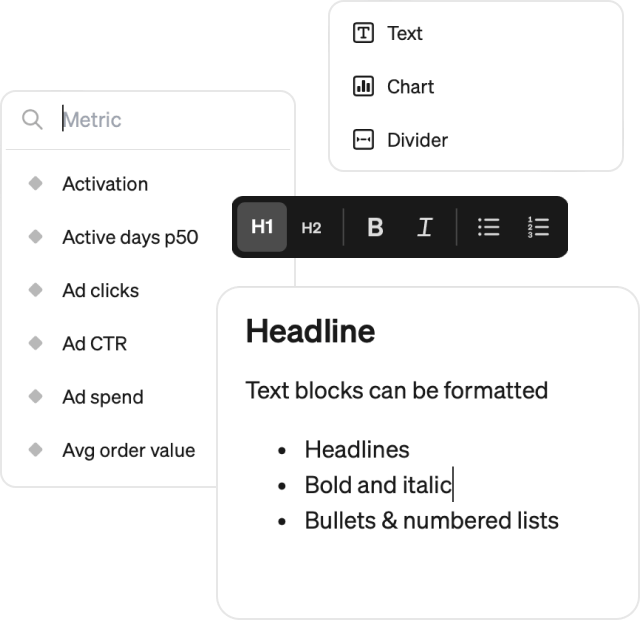
Your building blocks
Reports are built out of simple and powerful blocks. Create a block anywhere, drag & drop them and create advanced layouts.
- The text block lets you write formatted text of any kind
- Add metrics with the fully customizable chart block
- Use dividers to separate your content
- More block types, like tables and callouts, will be available soon.
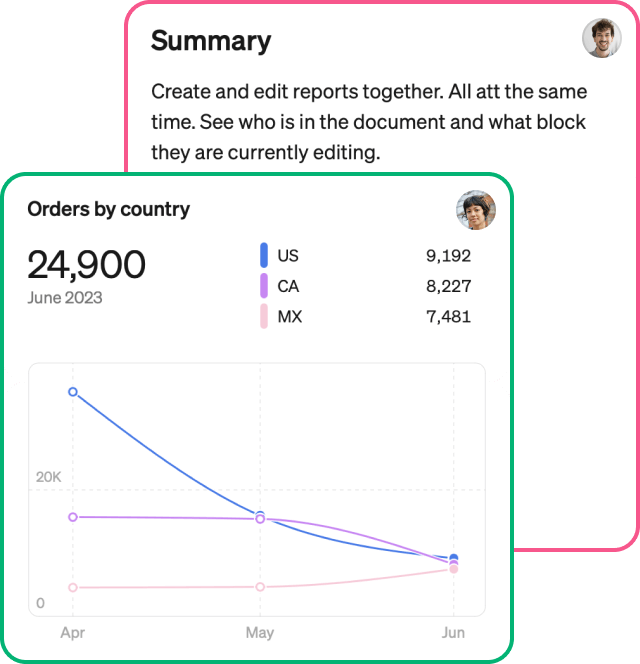
Multiplayer
Create insights together. Reports support full multiplayer editing so multiple people can jump into the same report and work together.
- Supports live updates from any number of editors
- See who's in the report, and which blocks they are working on
- Great for remote work and hybrid collaboration
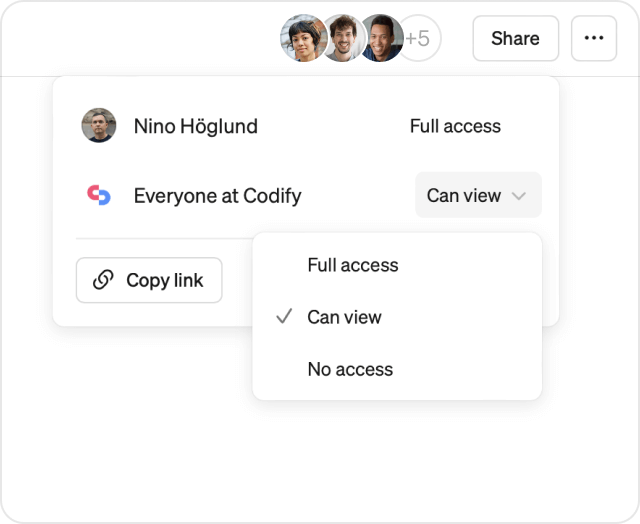
Sharing
Flexible sharing helps you to collaborate and communicate effectively. And it works just like you would expect in a modern tool.
Reports are easy to create for anyone and they start out as private. You can invite others to edit together or publish for everyone to view. Share a link to your report in email or slack to make sure the right people see it.
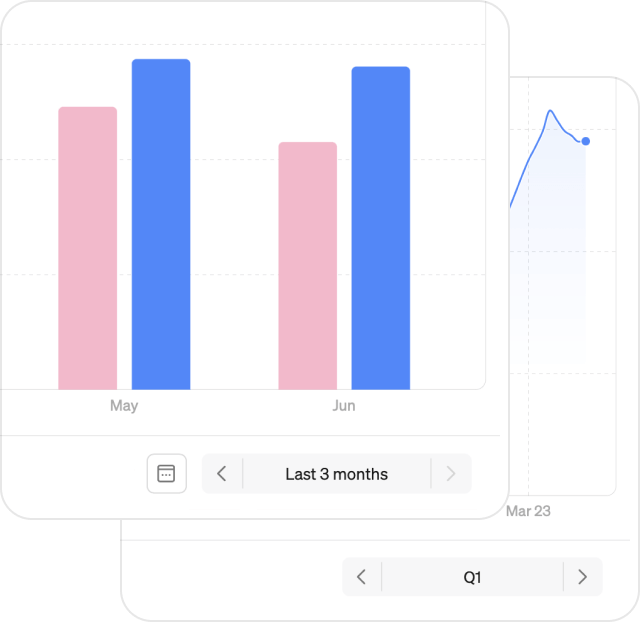
Fixed and rolling periods
Reports works great both with rolling time periods, for tracking development over time, and fixed time periods, where your charts stay fixed on a chosen period (like Q1 2023).
This gives you the control to both do classic rolling dashboards but also efficient reporting and well-structured analyses on a specific moment in time.
And more…
- Save customized charts to your reports, directly from any metric screen
- Access all reports in the mobile app
- Zoom into chart blocks or navigate to the metric to continue exploring
- Set custom titles on charts to tell your story
- Drag and drop everything for faster layout
Examples 🌟
There are numerous ways to use reports. Here are a few example use cases to inspire you:
- Key metric update: Deliver the latest updates on your key metrics to your stakeholders. Next period, simply duplicate the report and update the time period.
- Deep dive analysis: Craft a well-structured analysis and walk readers through your findings. Visualizations are always easy to update.
- Live tracker: The classic dashboard use case. Set time periods to rolling and add a set charts to track important metrics vs. targets.
- Ad-hoc analysis: During meetings, open up Steep and collaborate with others to find answers to spontaneous questions. Allow everyone to contribute to the same report.
- Personal exploration: Investigate for yourself and save charts in a private report that you can iterate on before sharing with others.
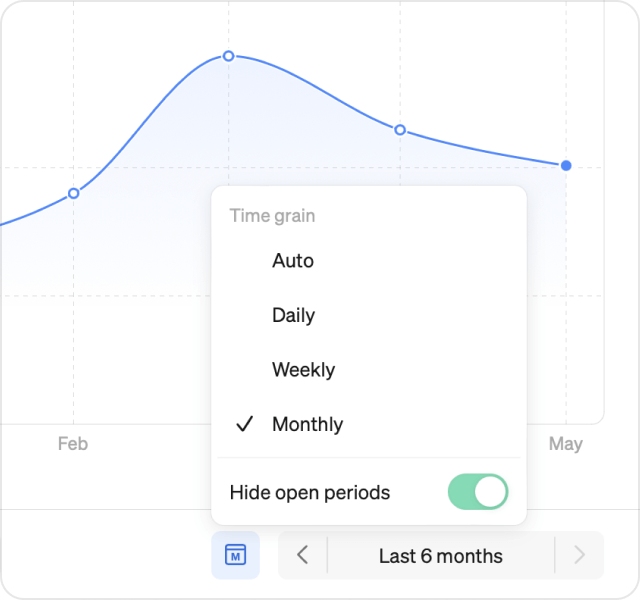
Time grains
Also new this month - you can now choose a custom time grain when exploring metrics. Switch between Daily, Weekly or Monthly. By default, Steep uses a time grain that matches the current zoom level and visualization. We have also added the ability to hide open time periods. Perfect for reports.
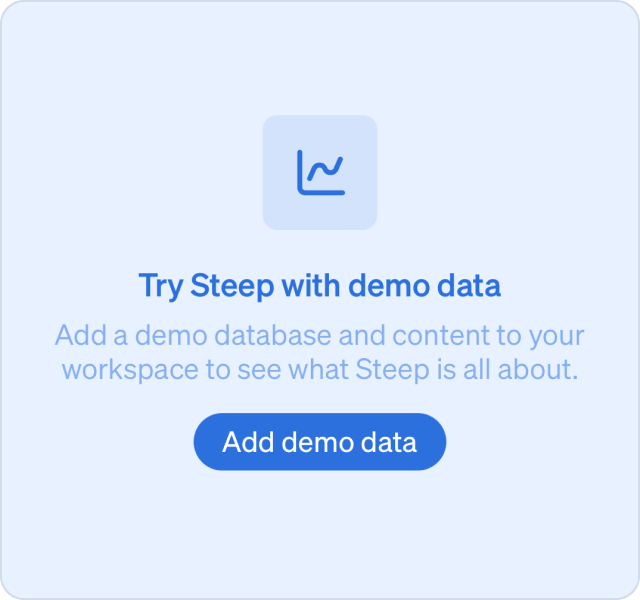
Demo mode
The demo mode has been improved and we have added more metrics, teams and reports for you to explore and play around with.
To get started, create a workspace and hit the Use demo data button.
Book a demo
Get help with exploring the platform and discussing use cases for your team.
Get started
Explore for free. Get your own workspace or try the demo setup.
More posts

Intro to Steep
By Janna Pollari·Events

Webinar with Daana
By Janna Pollari·Events

Meet us at Snowflake Summit 2026
By Deanne Anderson·Events
Introducing Steep AI
By Nino Höglund·Product

A builder's guide to the Steep API
By Hanna Kjellén·Inside Steep
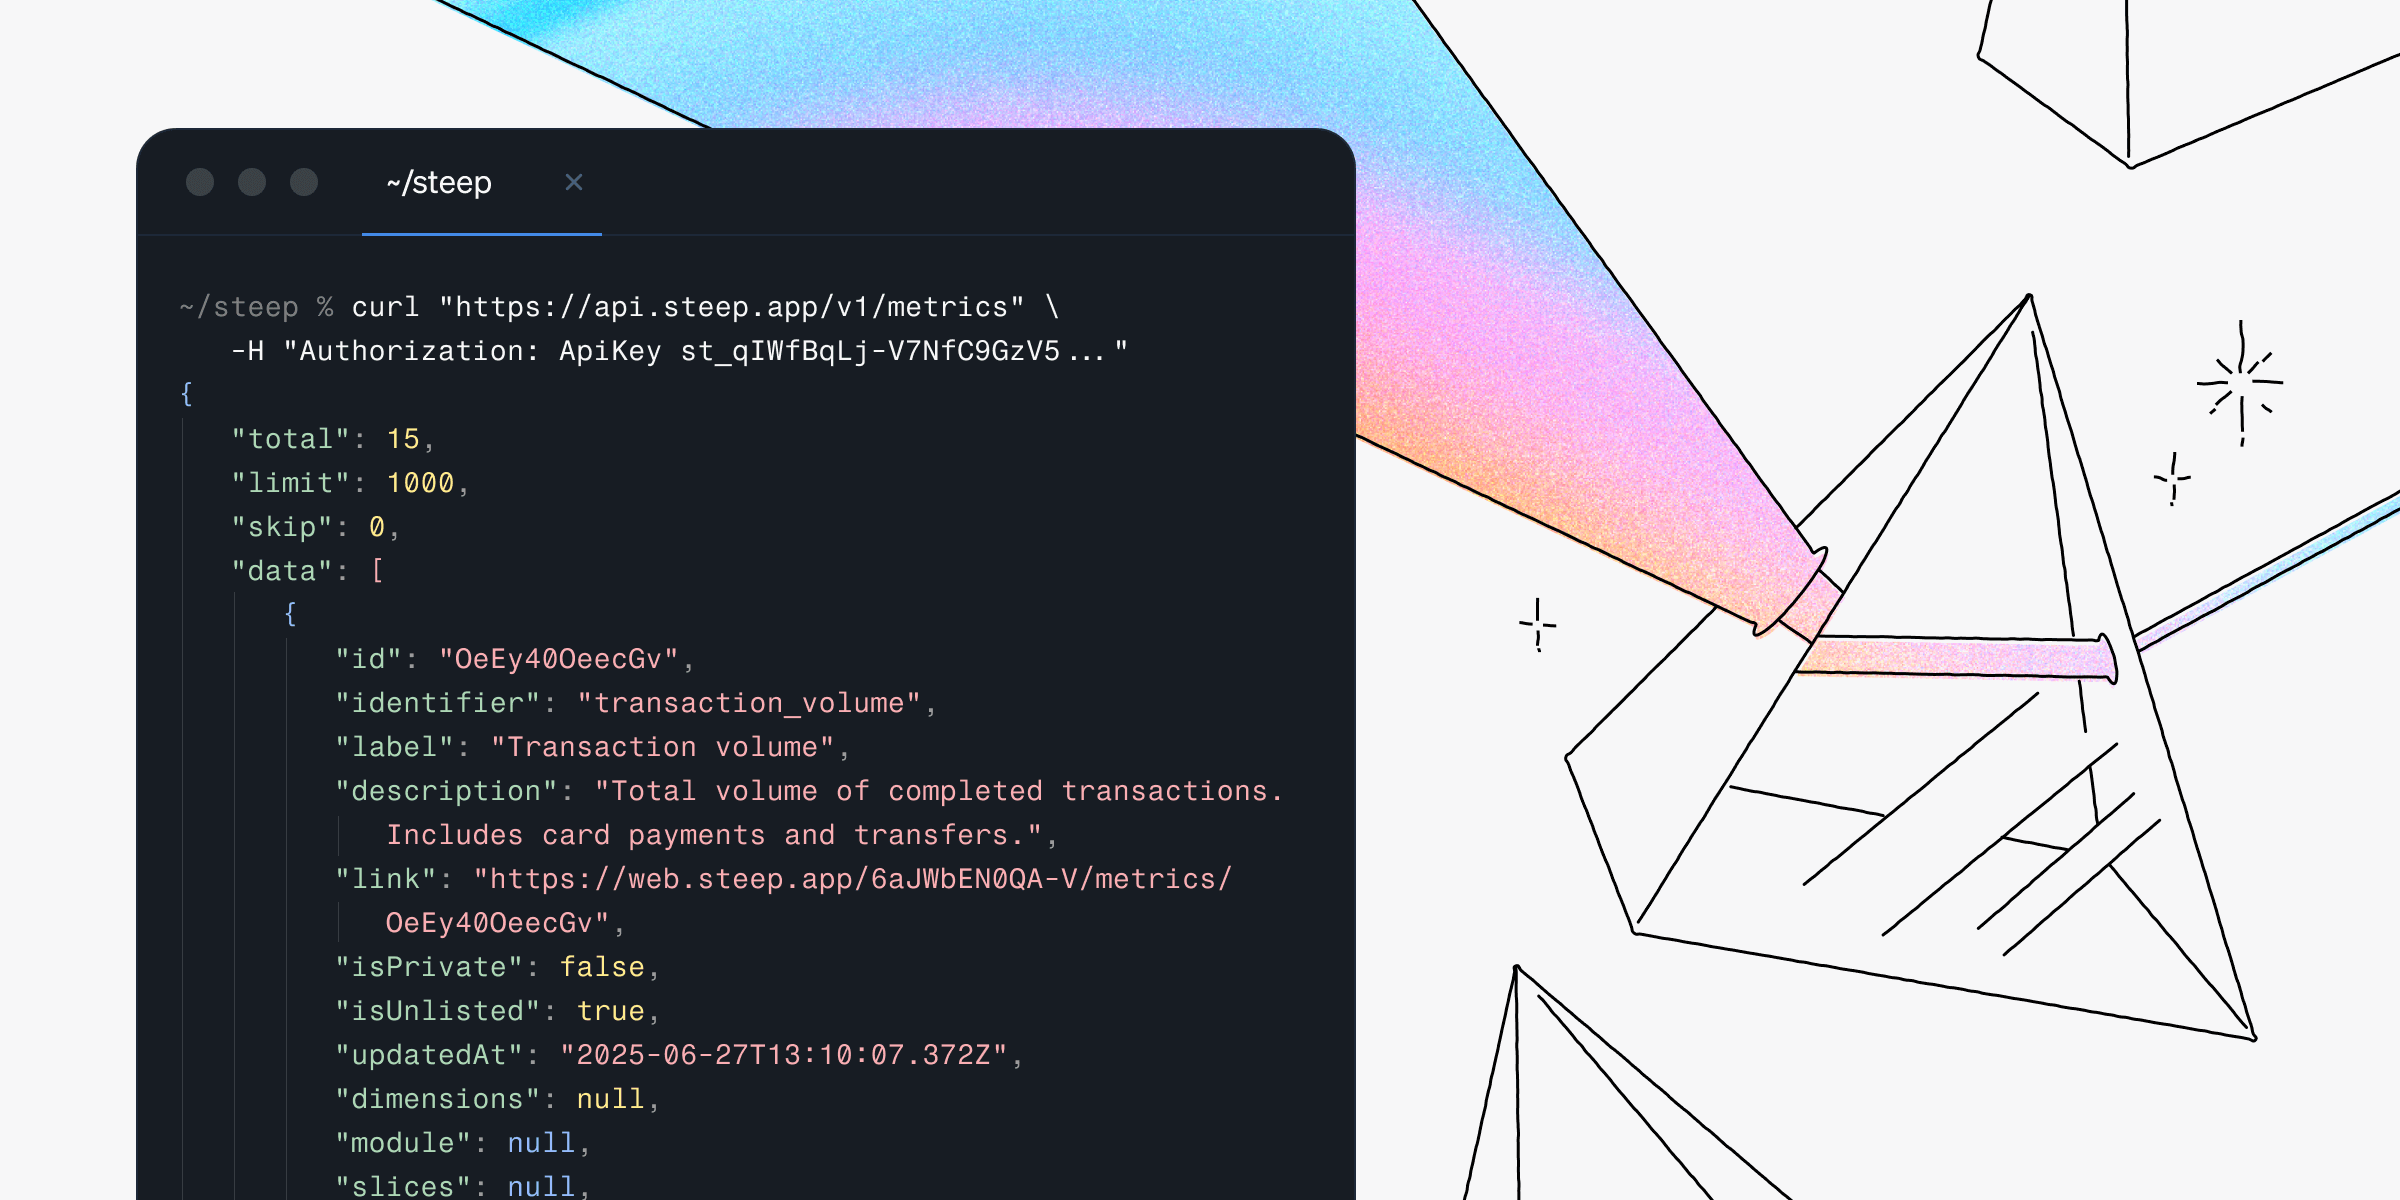
New in Steep: API – Metrics power anything
By Nino Höglund·Product