We've listened to our users and focused on small but mighty improvements that take your Steep-experience to the next level. Enjoy this month's product update with 17 improvements to Steep!

Smarter filtering
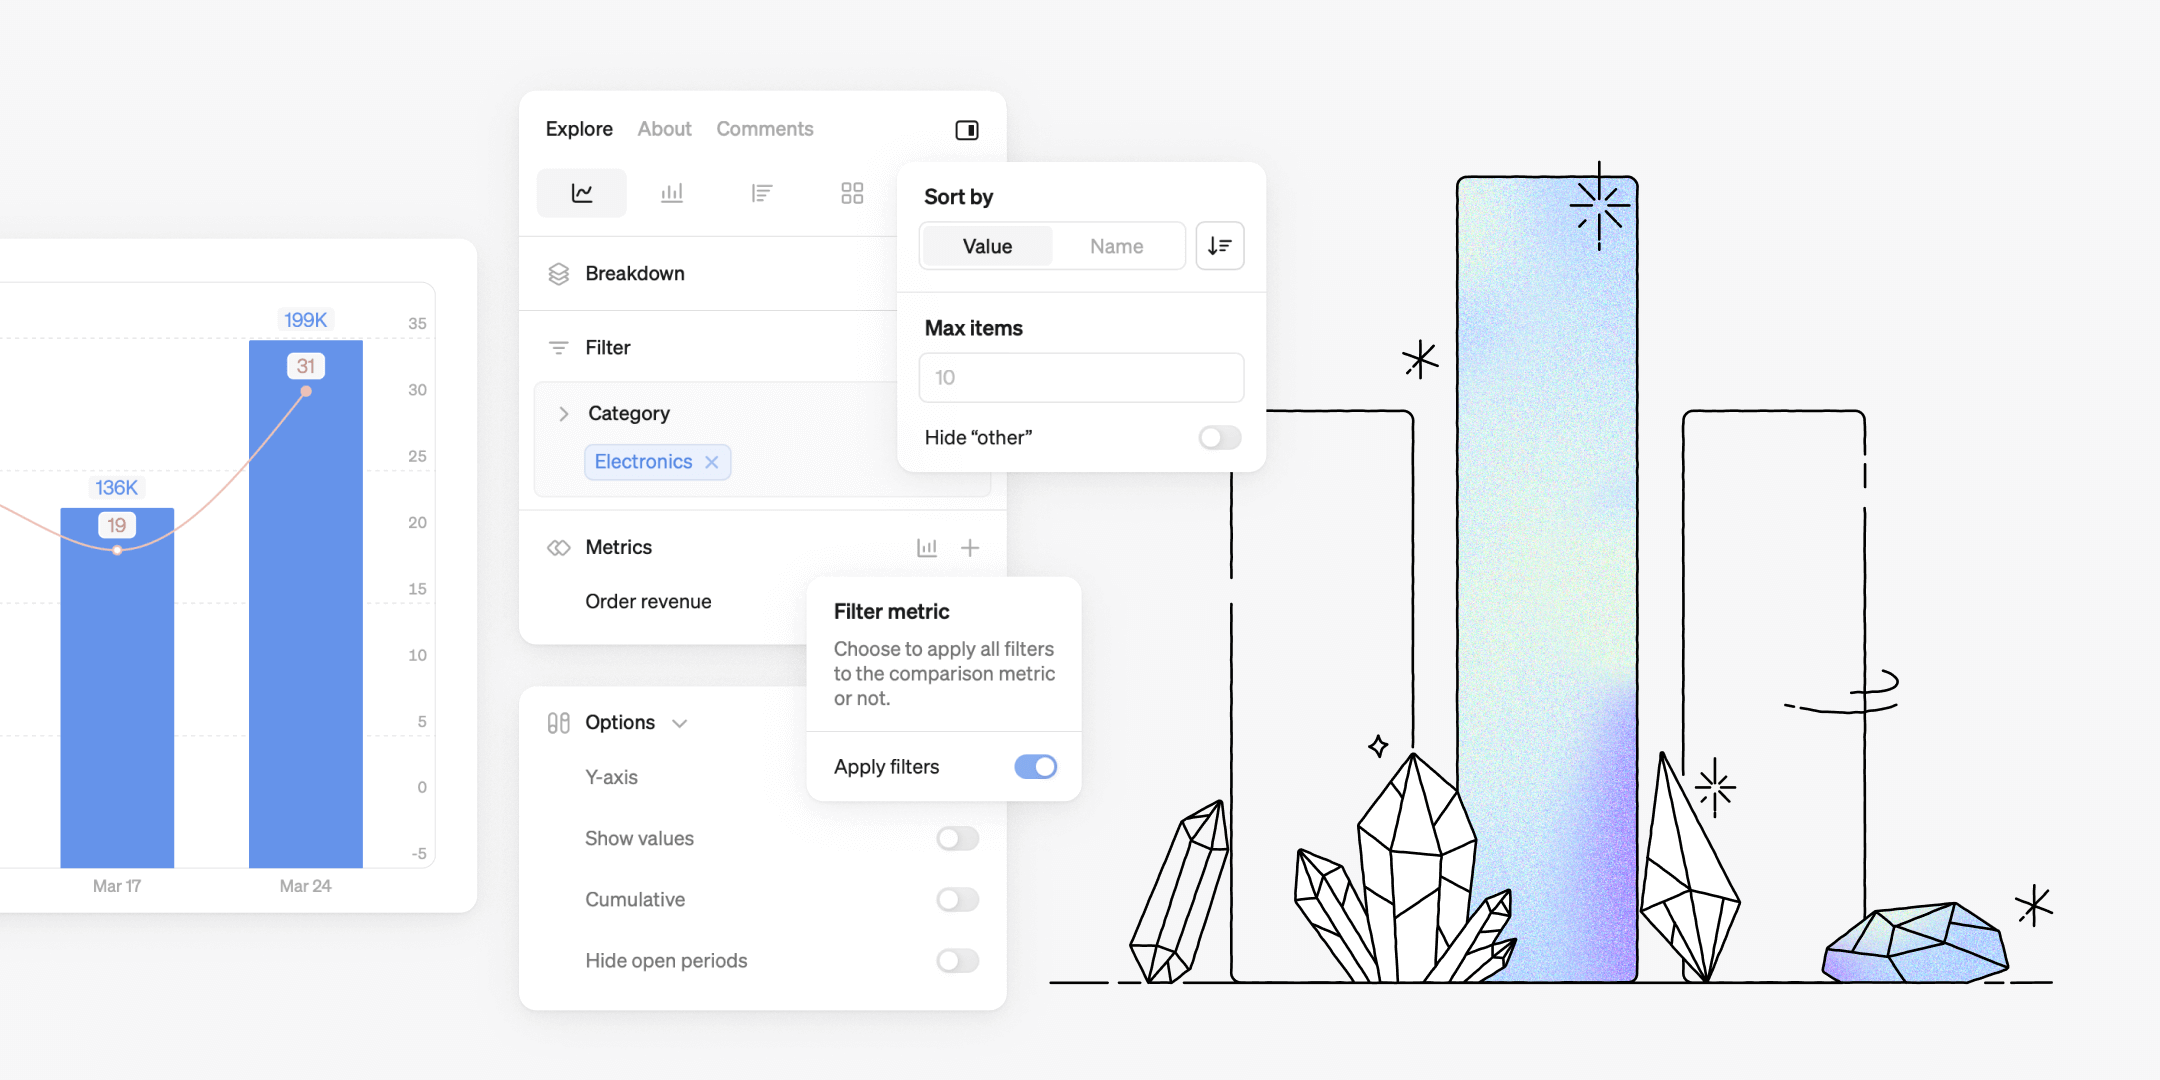
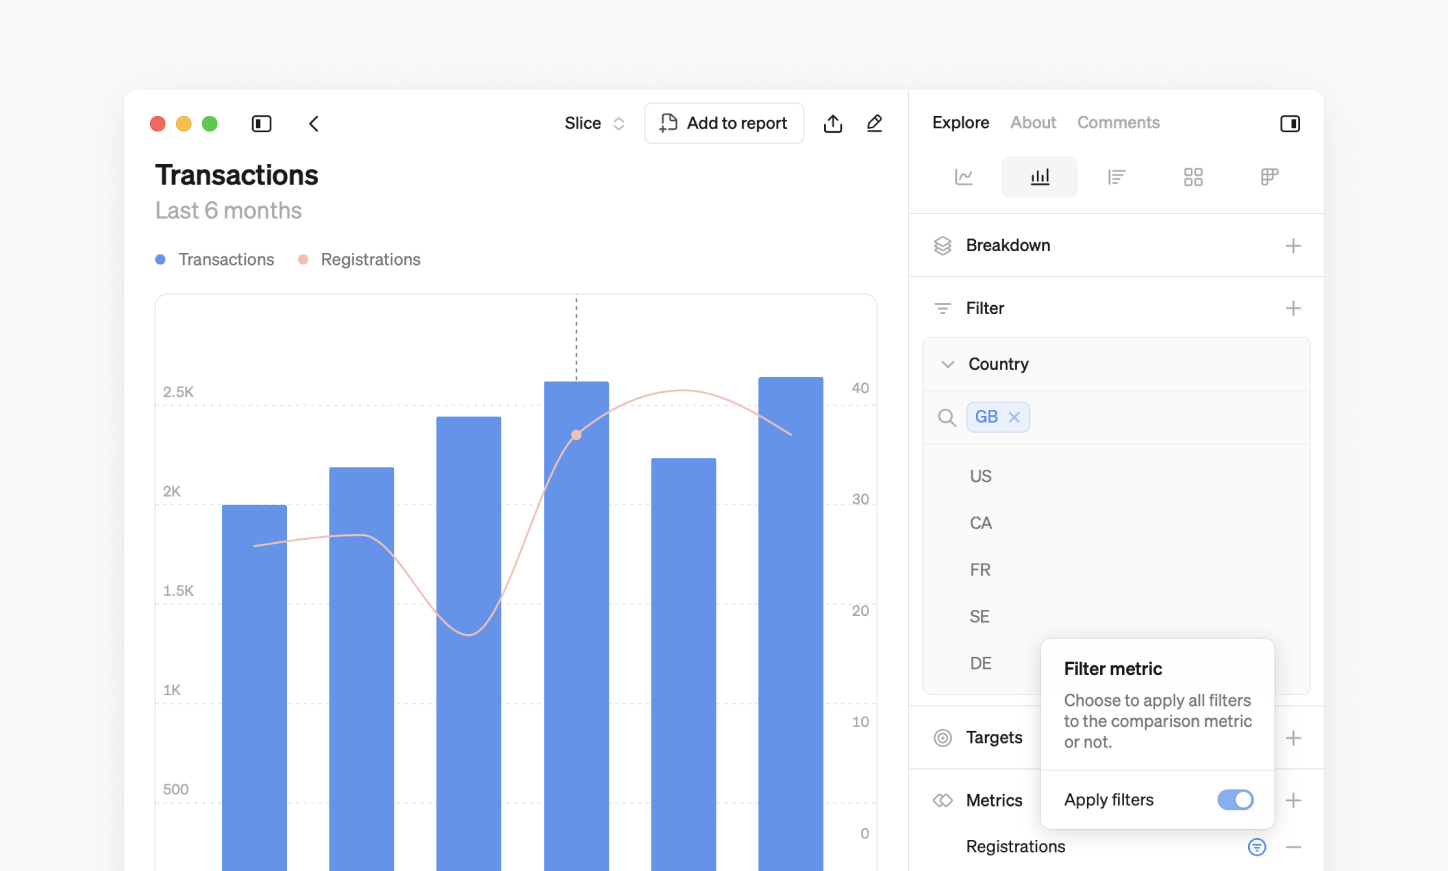
Now, when you apply a filter to a chart with multiple metrics, the filter is automatically applied to all metrics where the dimension value is available. You also have the flexibility to bypass the filter for metrics you don't want to include.
Customize your breakdowns
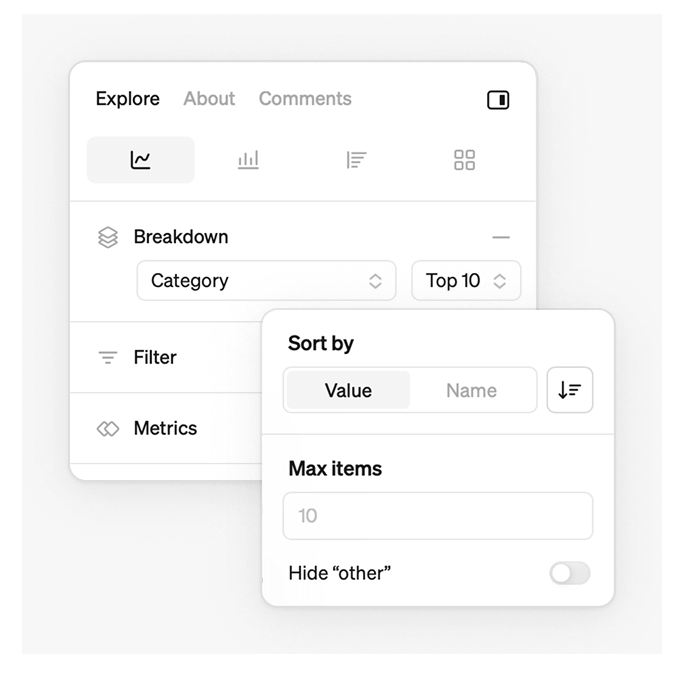
We've added new customization options when breaking down bar, line and rank charts, giving you more ways to tailor your visualizations. You can:
- Choose whether you want to sort by top or bottom performance.
- Sort on dimension value or value name.
- Select how many dimension values you want to display.
- Choose if you want to display “other” values.
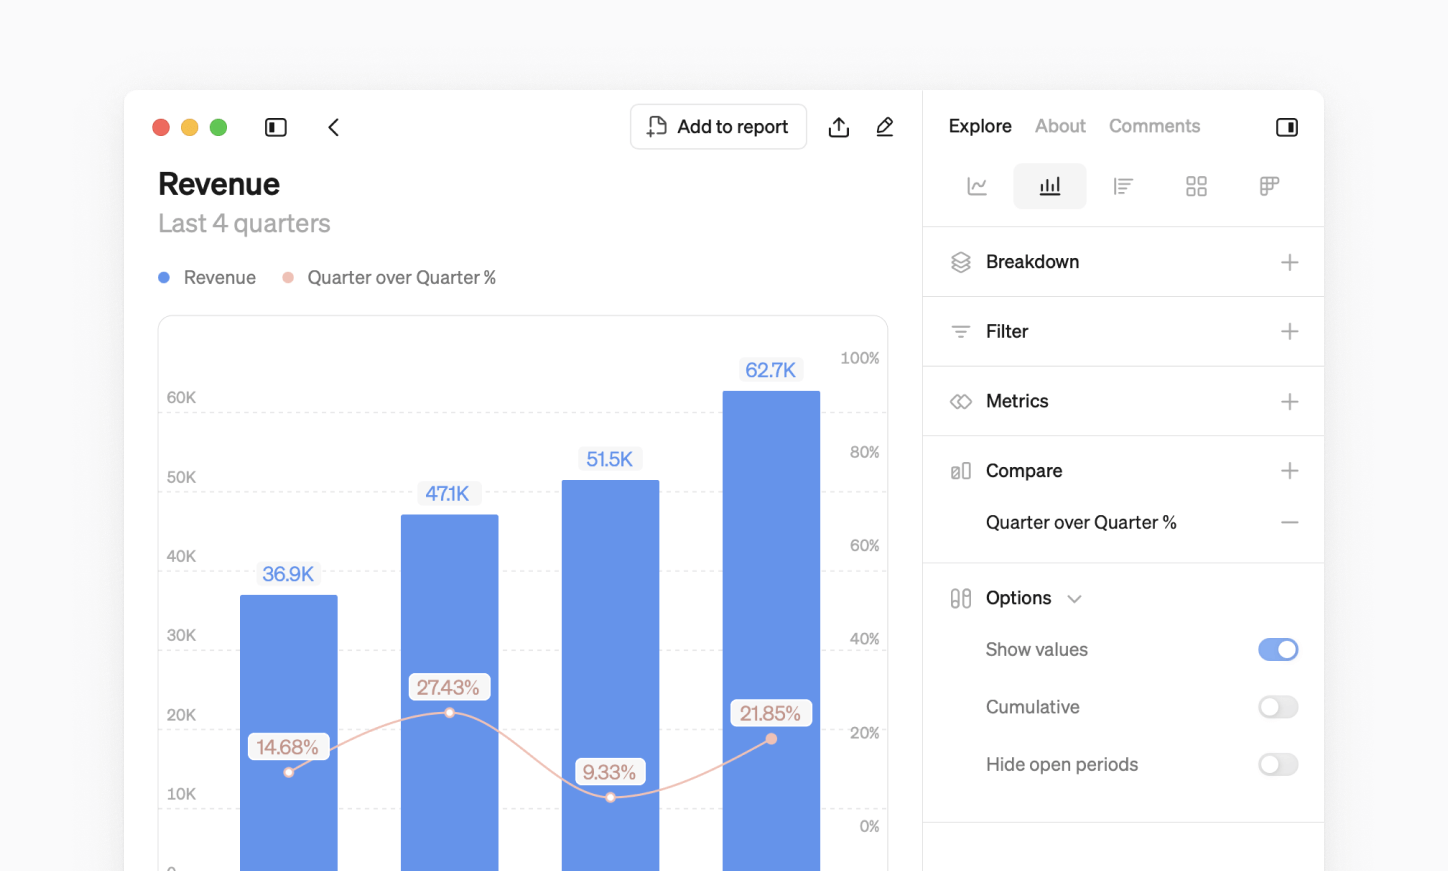
New options for charts
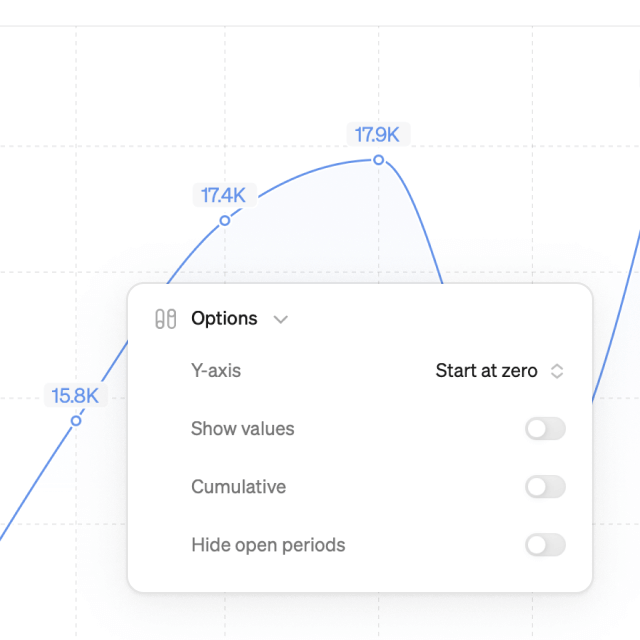
We've added more ways to fine-tune your charts for clarity and control.
- Display values on bar and line charts to follow trends more easily.
- Choose between starting from zero or hugging the values on your chart to optimize scaling.
- When looking at 100% stacked bar charts, we now show % in the legend
MoM and YoY comparisons
You can now add comparison lines for any time grain to quickly see how you're growing week over week, month over month, quarter over quarter or year over year.
dbt semantic layer updates
- Dimensions are grouped by semantic model for better organization.
- Numeric dimensions can now be used in filters for better precision.
More general updates
- Steep now supports SAML SSO, making authentication smoother and more secure.
- When a user leaves a workspace, their shared reports are now editable by any user or group who had read-only rights.
- You can now print reports with an improved layout, when using Steep in a desktop browser.
- Metric names now wrap onto two lines in big number and table blocks. If they still don’t fit, hover to see the full name in a tooltip.
- Slice names are now displayed in the legend and use distinct colors to differentiate them from the main metric.
- The left navigation and most side panels are now resizable. Double-click the divider to reset the size.
Book a demo
Get help with exploring the platform and discussing use cases for your team.
Get started
Explore for free. Get your own workspace or try the demo setup.
More posts

Intro to Steep
By Janna Pollari·Events
Webinar with Daana
By Janna Pollari·Events

Meet us at Snowflake Summit 2026
By Deanne Anderson·Events
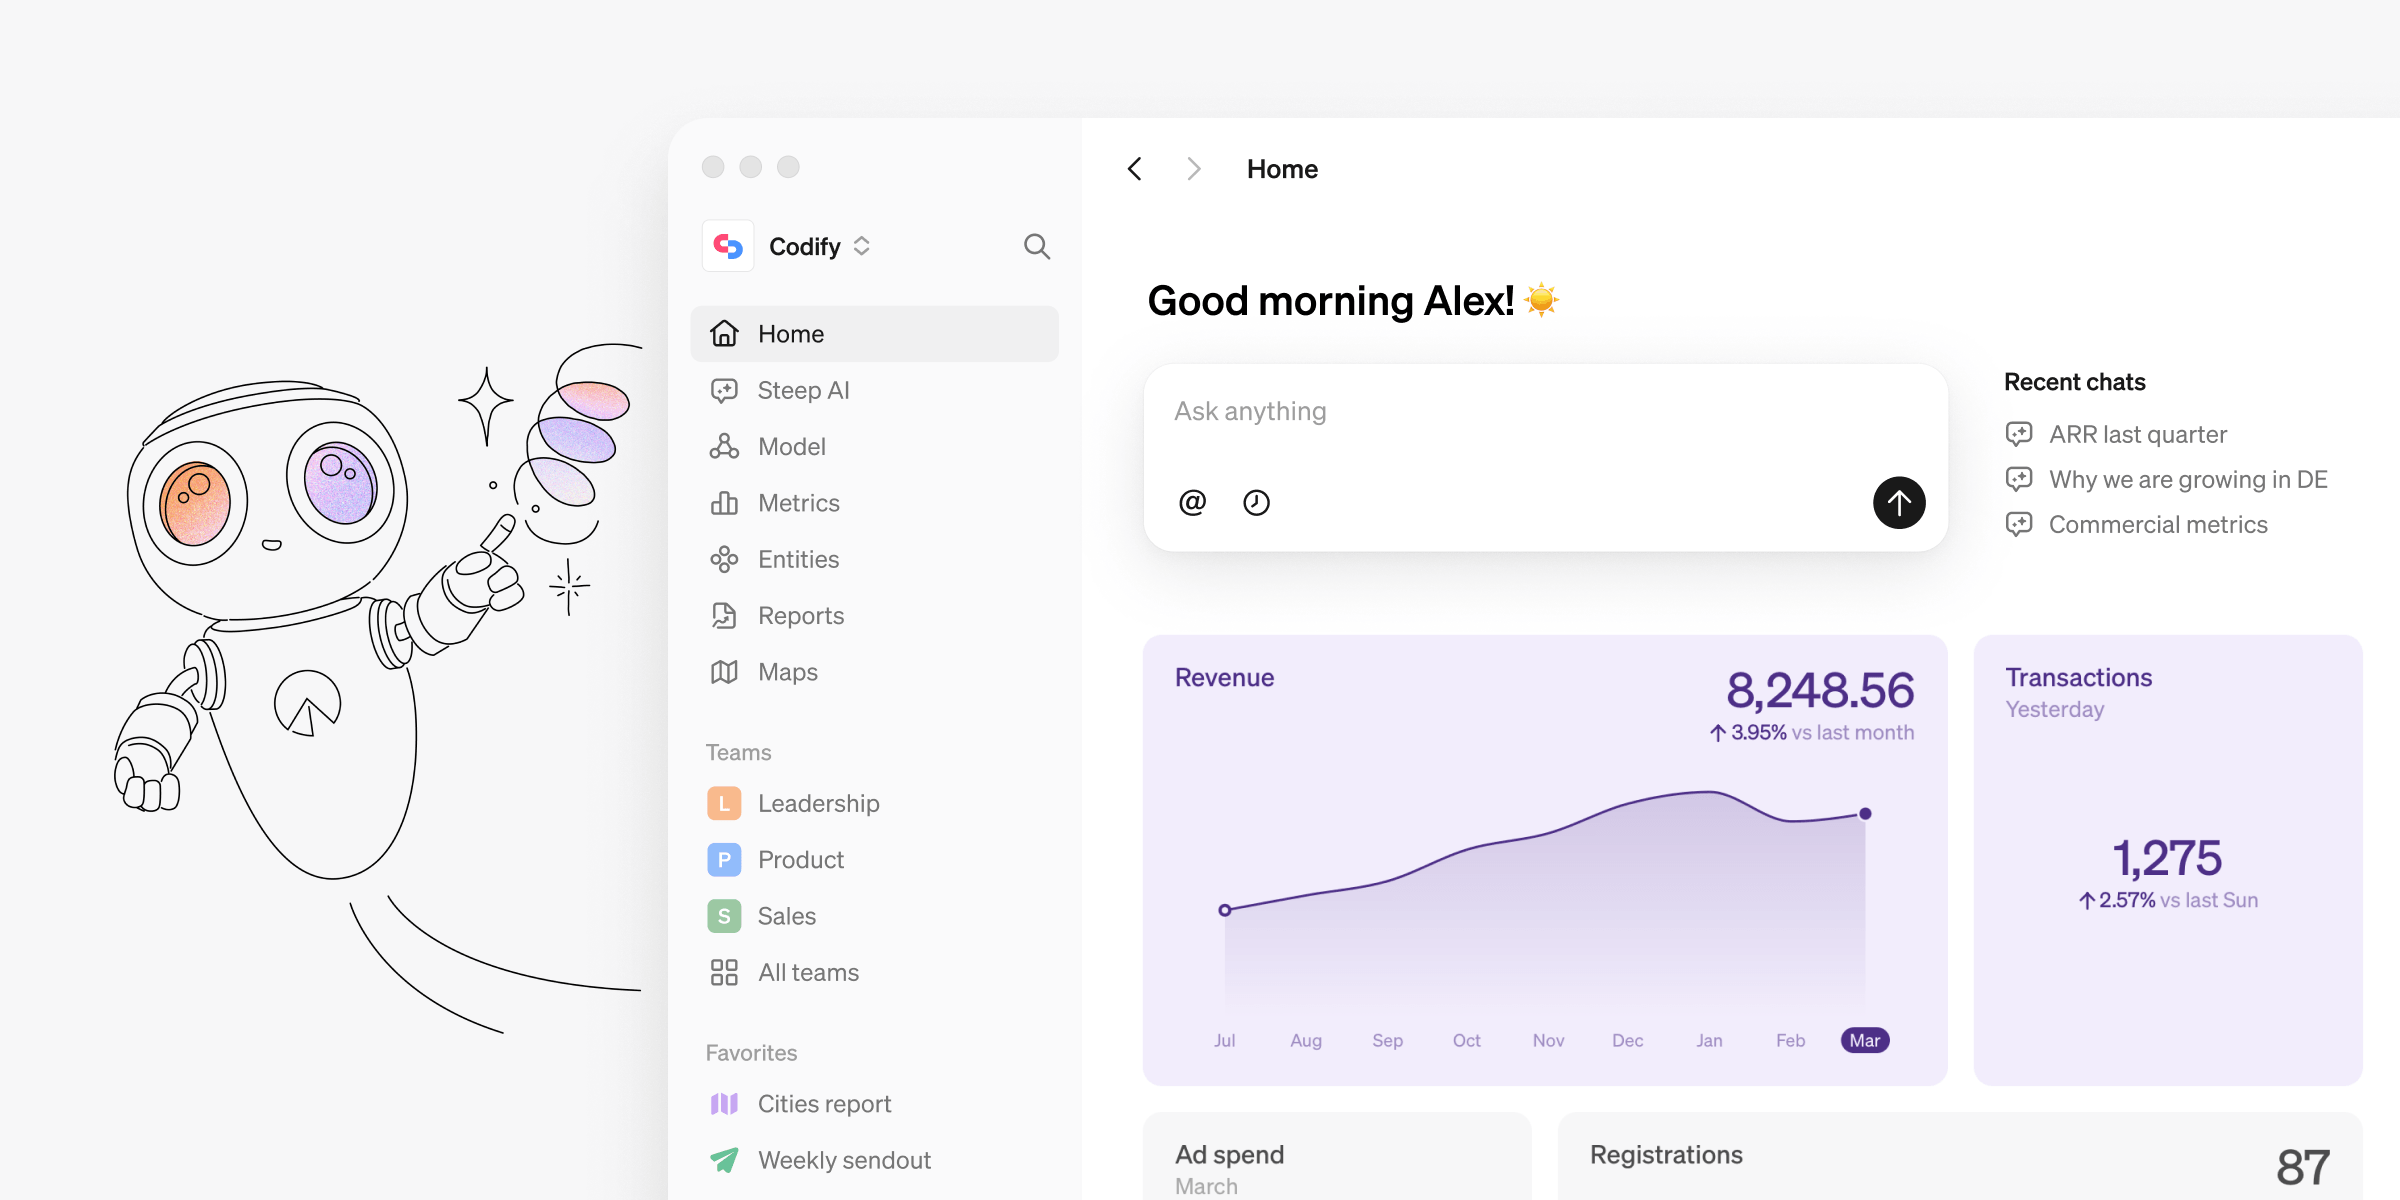
Introducing Steep AI
By Nino Höglund·Product

A builder's guide to the Steep API
By Hanna Kjellén·Inside Steep
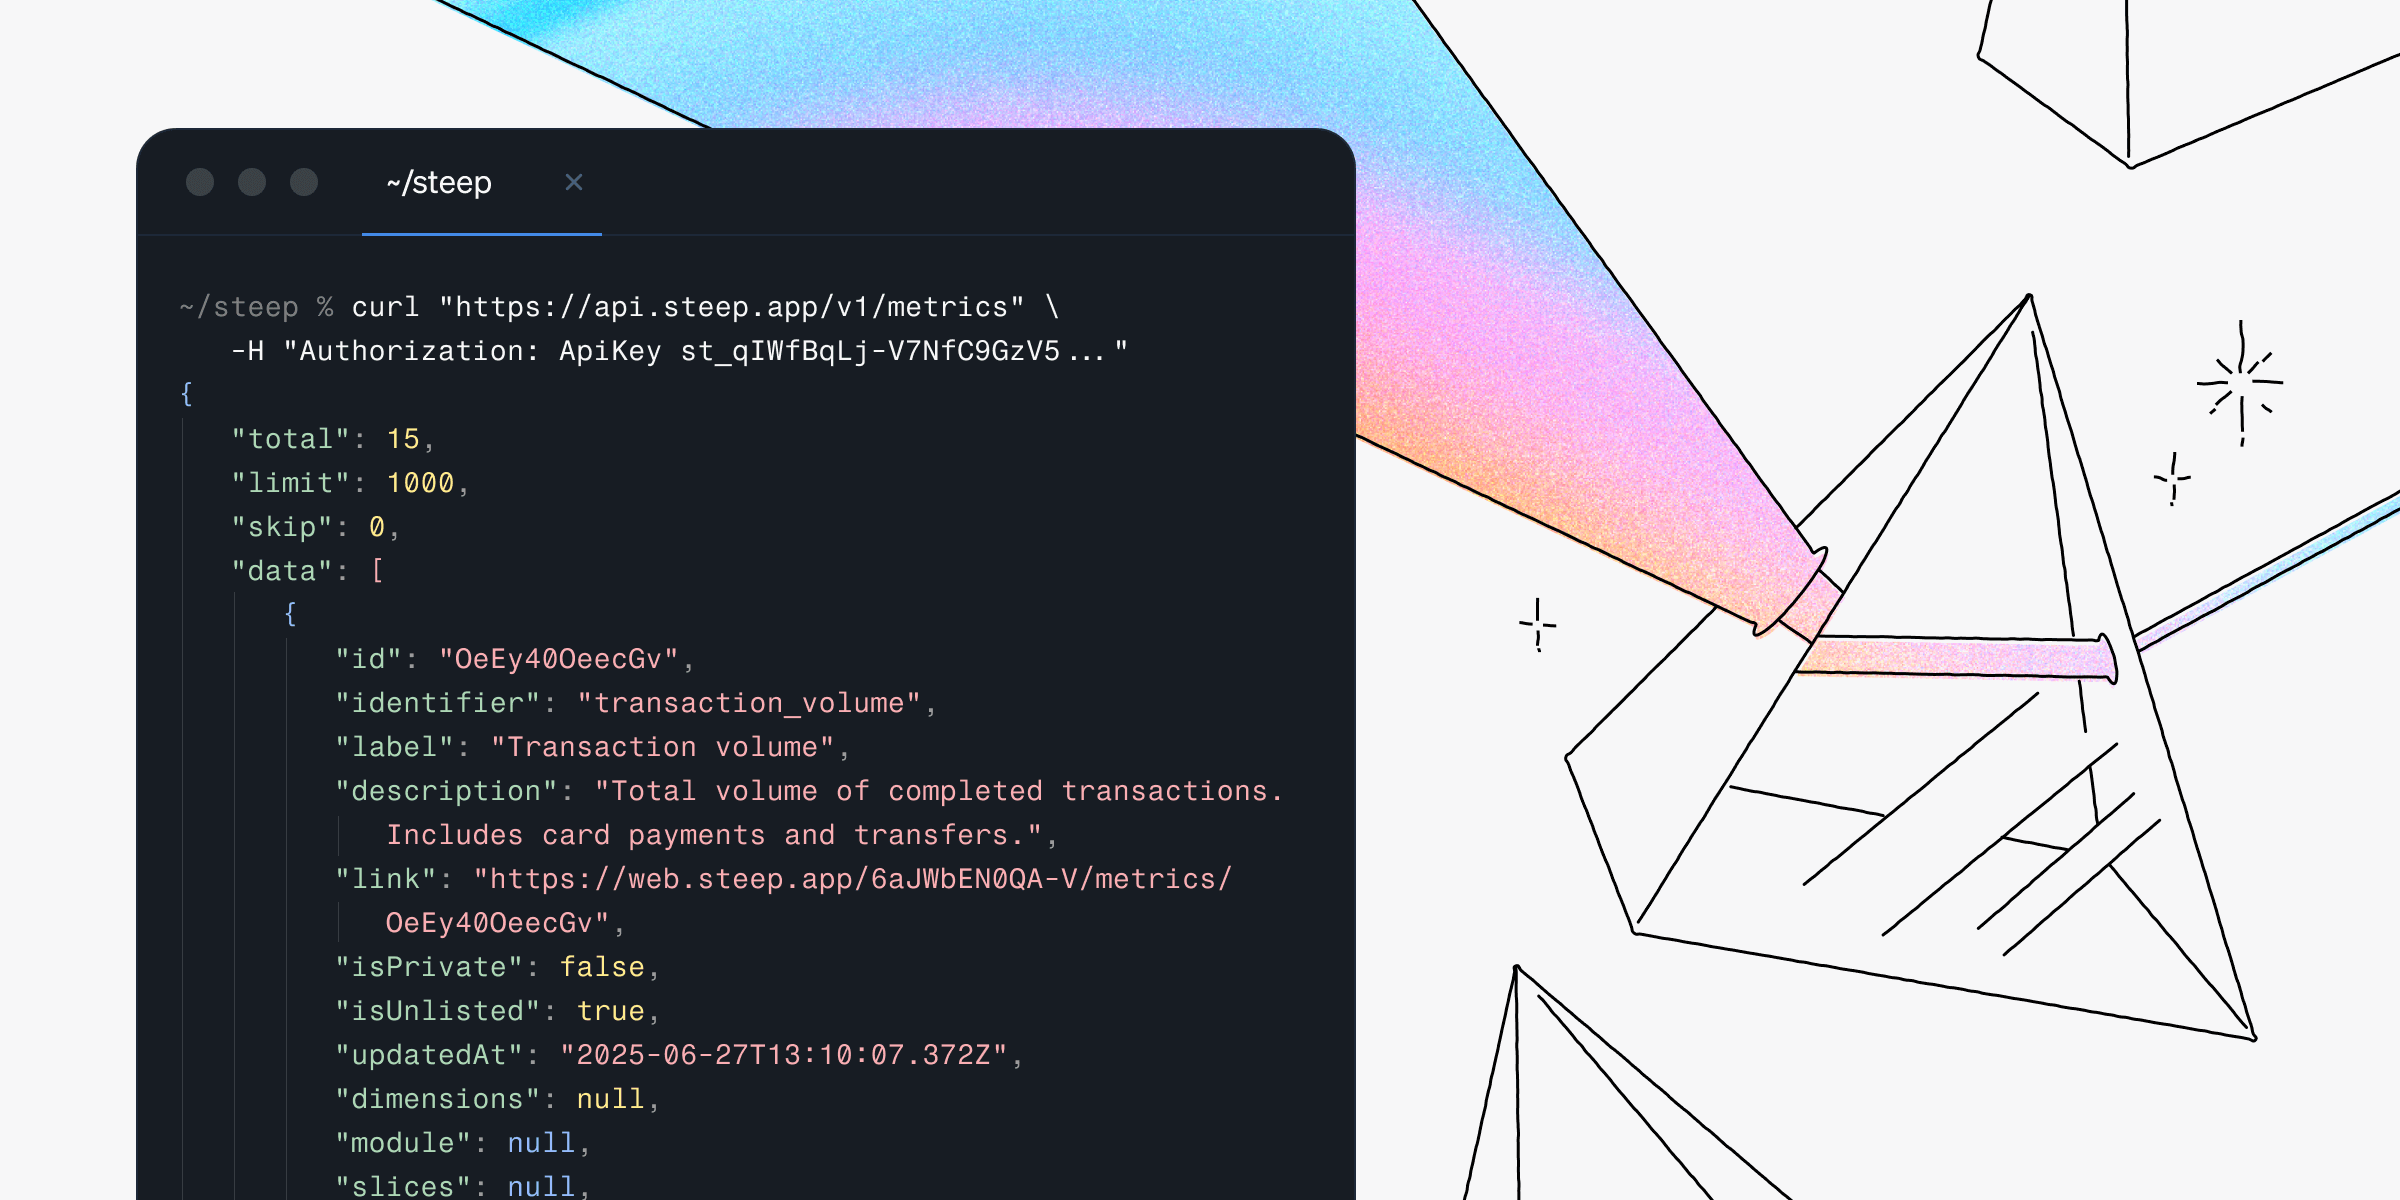
New in Steep: API – Metrics power anything
By Nino Höglund·Product