We're excited to introduce a game-changing addition to Steep's semantic layer. Entities unlock the power of row-level insights, giving you the tools to go beyond metrics and explore the granular details that drive your business.

Dive into row-level data
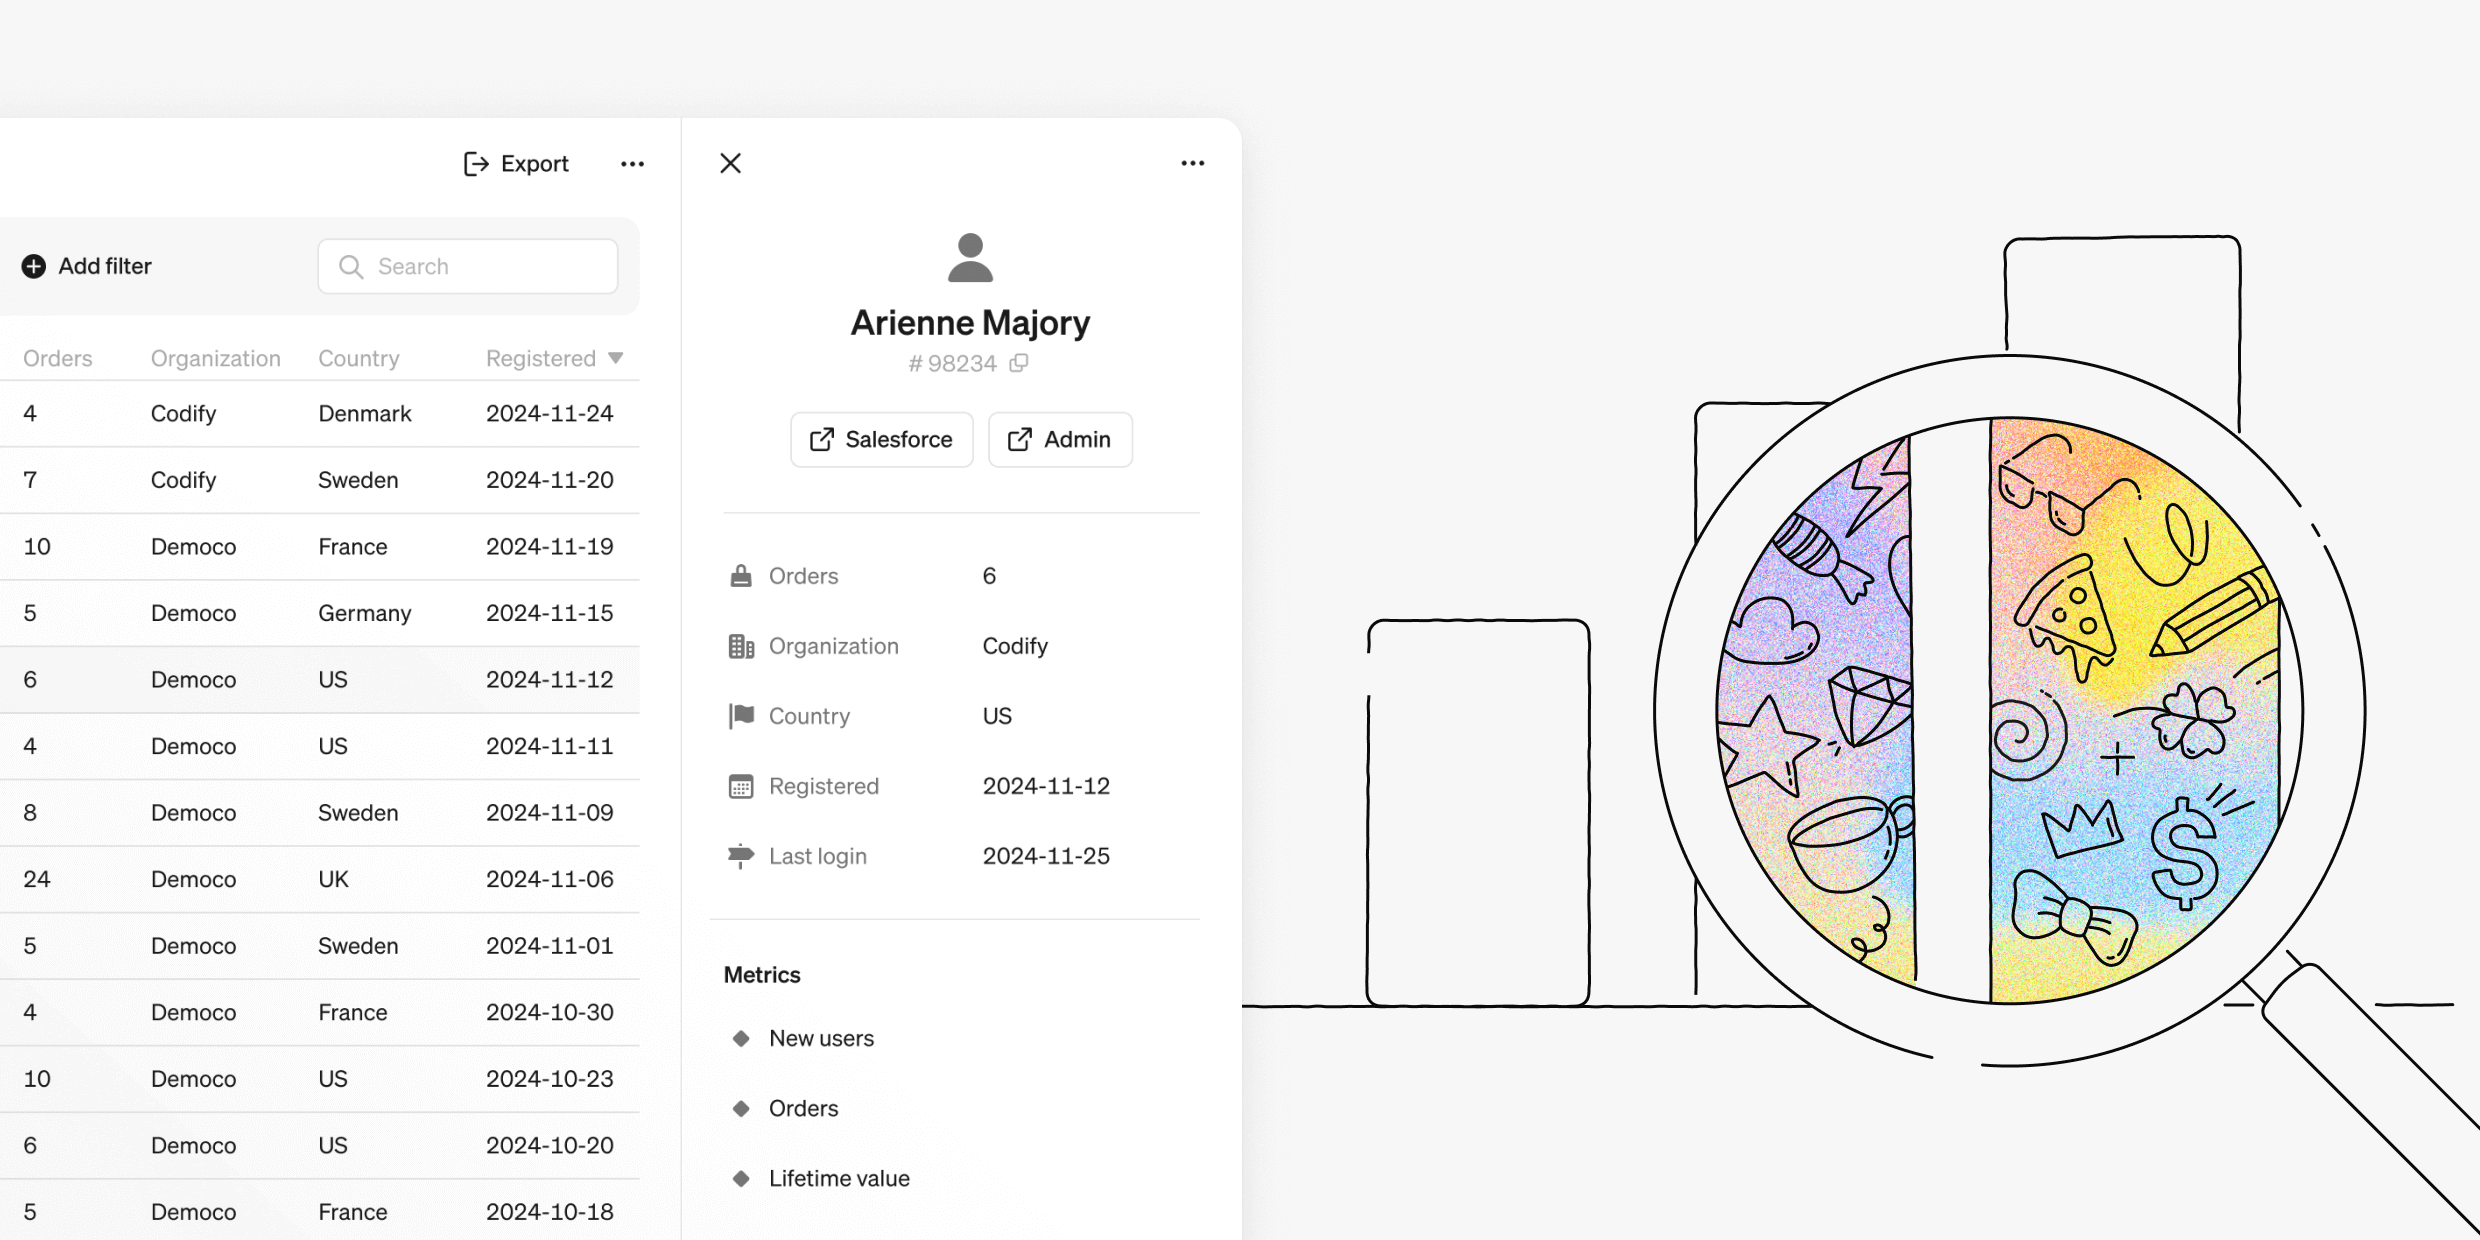
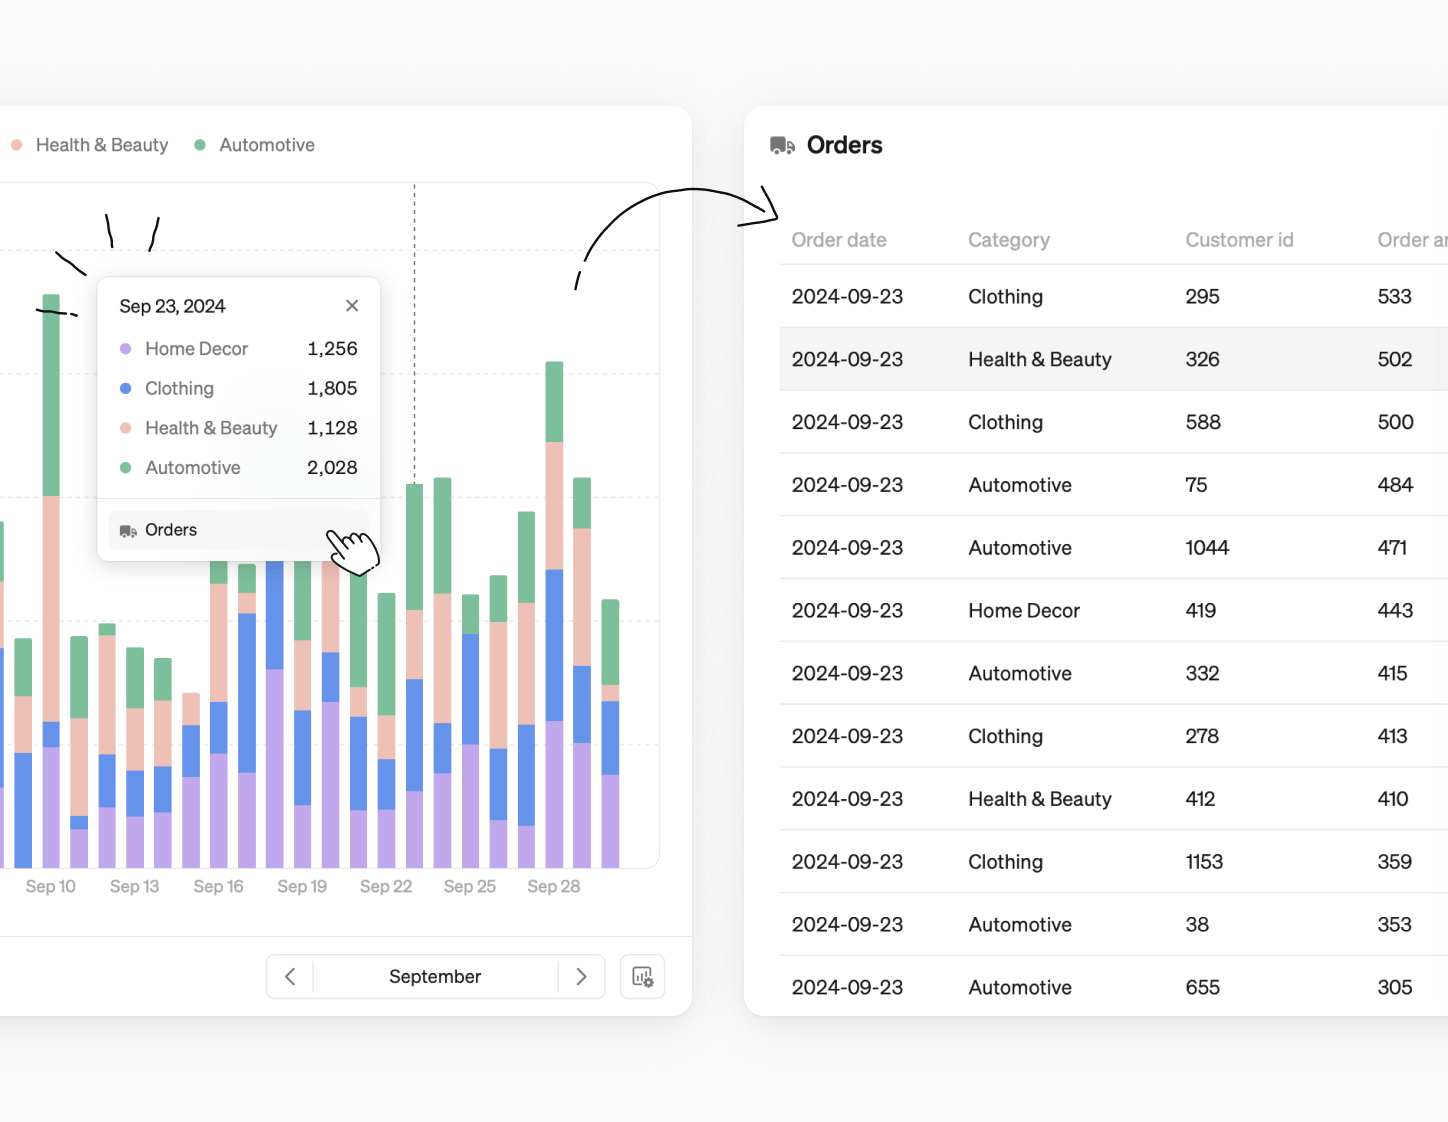
Entities let you effortlessly drill down to row-level data behind your metrics, whether you're analyzing customer behavior, product performance, or order details—even if the entity and metric come from different tables.
Simply click on a line, bar, or rank chart to explore connected entities. Choose the entity you want, and Steep will generate a filtered list with row-level details.
Entity lists
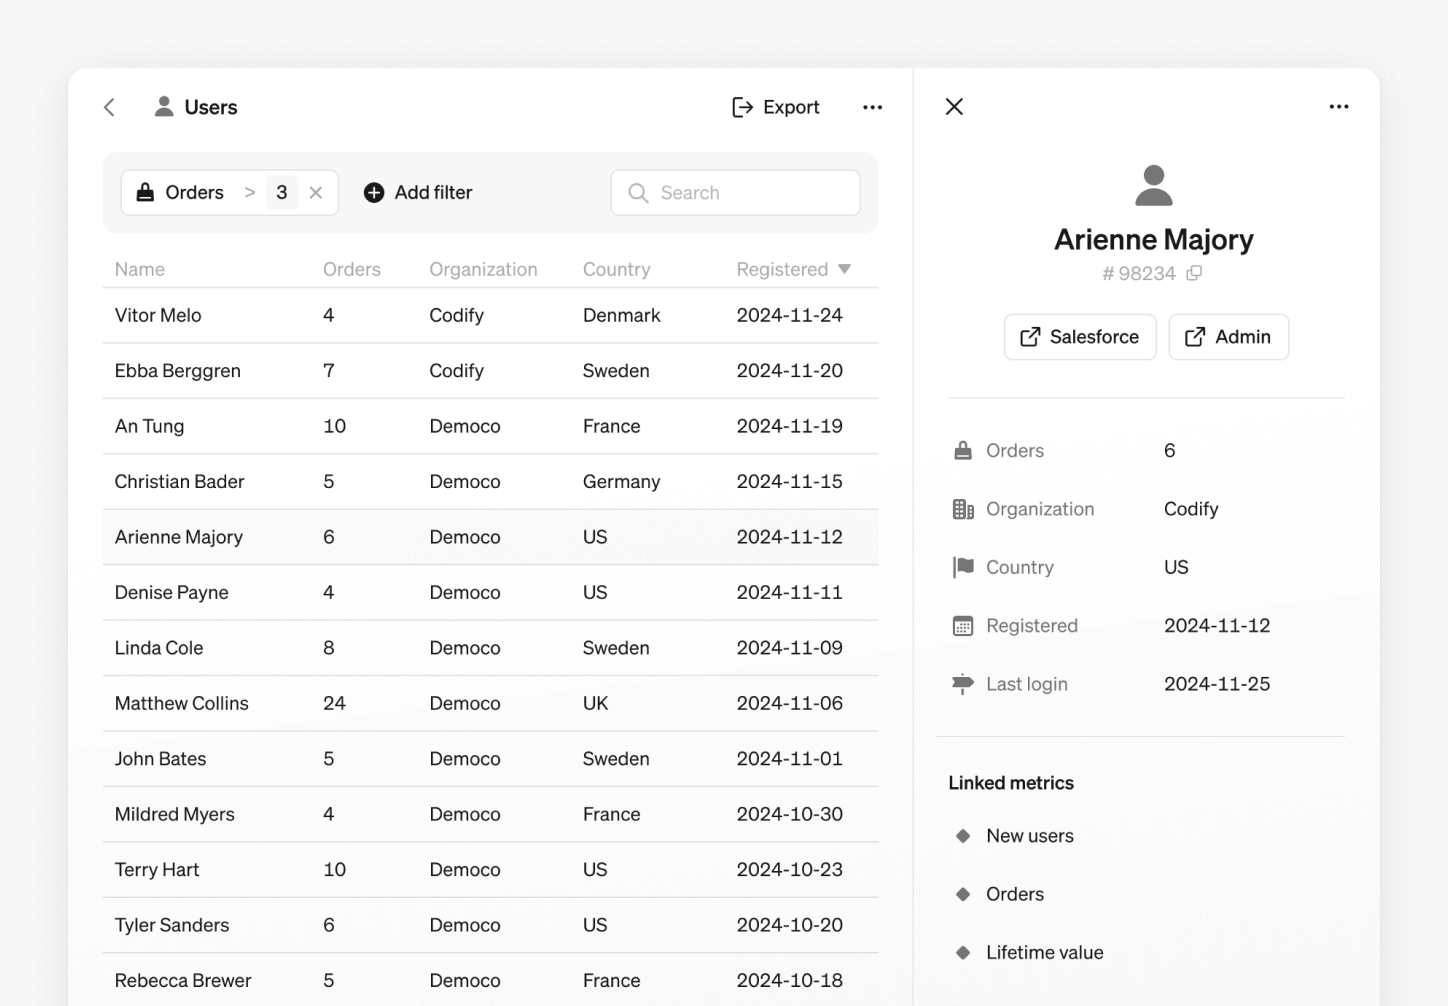
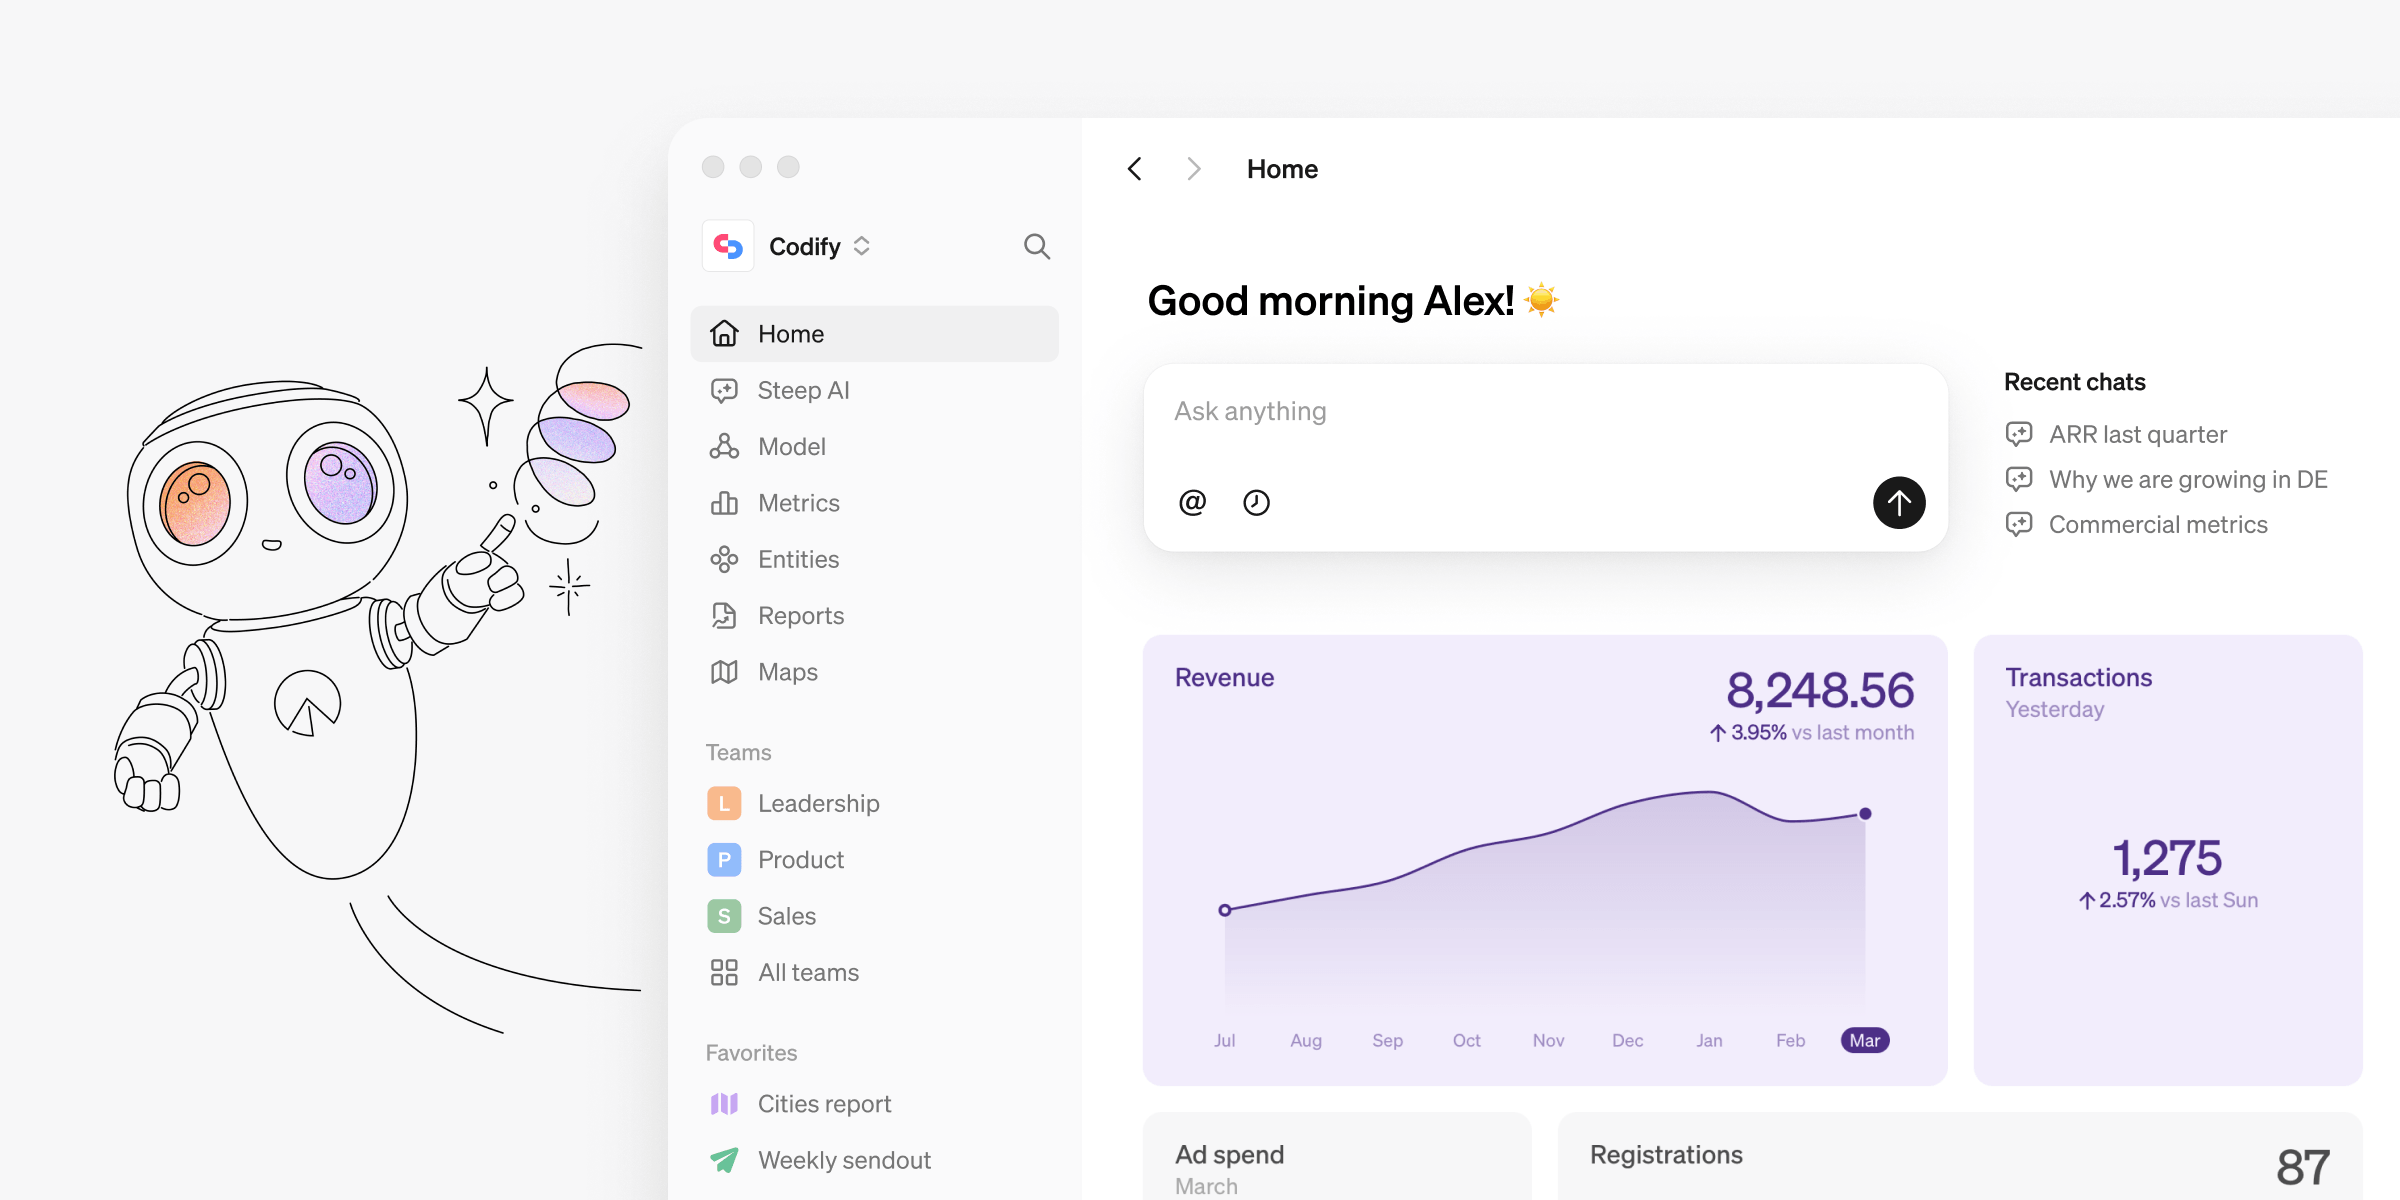
Access all entities from the navigation sidebar. From here, you can:
- Filter, sort, and export entity data.
- Open detailed views and copy links for sharing.
Filter and sort
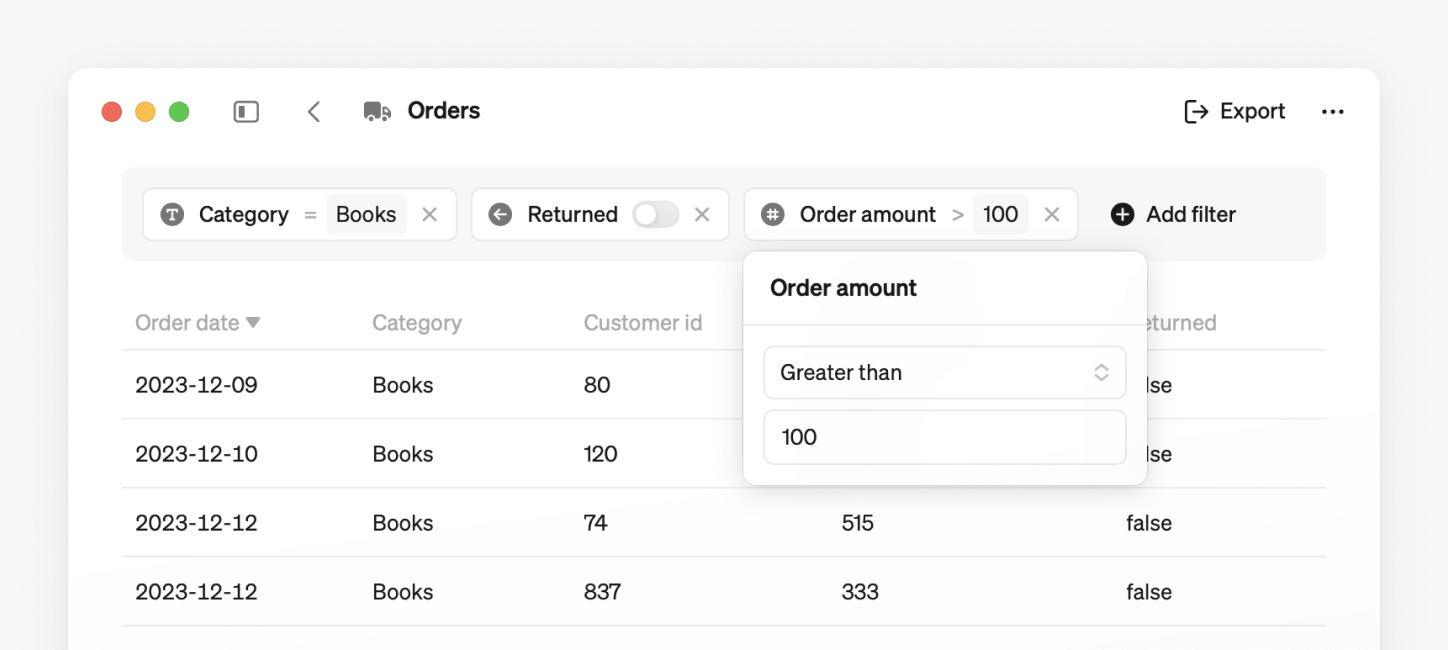
Refine your entity list effortlessly using filters based on entity properties.
- Filter: Apply filters based on text, numbers, dates, or booleans to refine the list.
- Sort: Click column headers to sort the list, toggling between ascending and descending order.
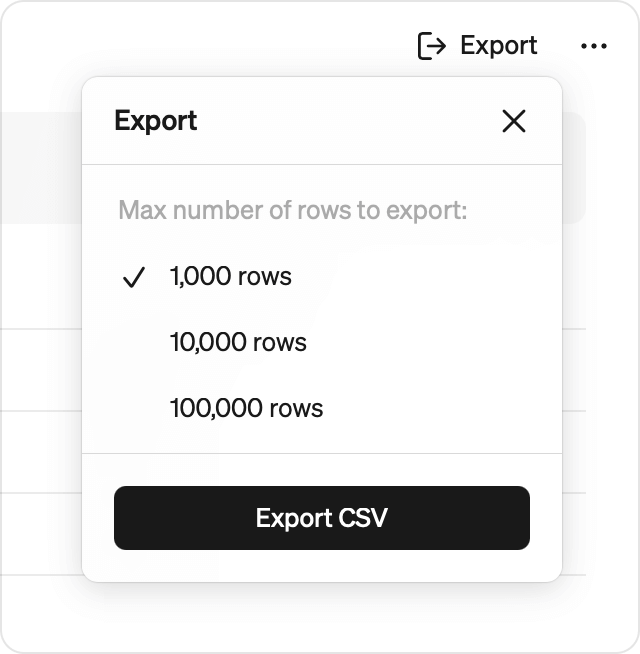
Export to CSV
Export your filtered and sorted entity list. Choose how many rows to include. Note that large exports may take some time.
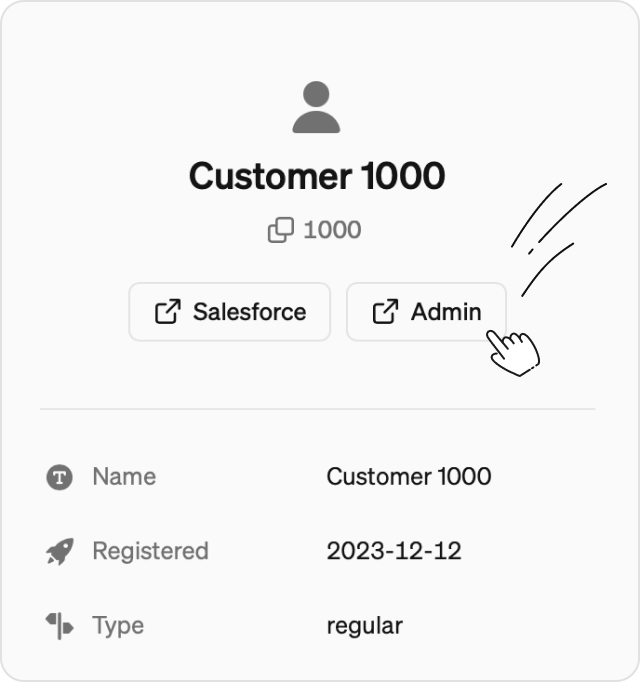
Link to other tools
Add custom links your entities, letting you navigate seamlessly to relevant web pages—like your internal admin tool, HubSpot, or other systems.
Learn how to get started with entities →
Also new this month
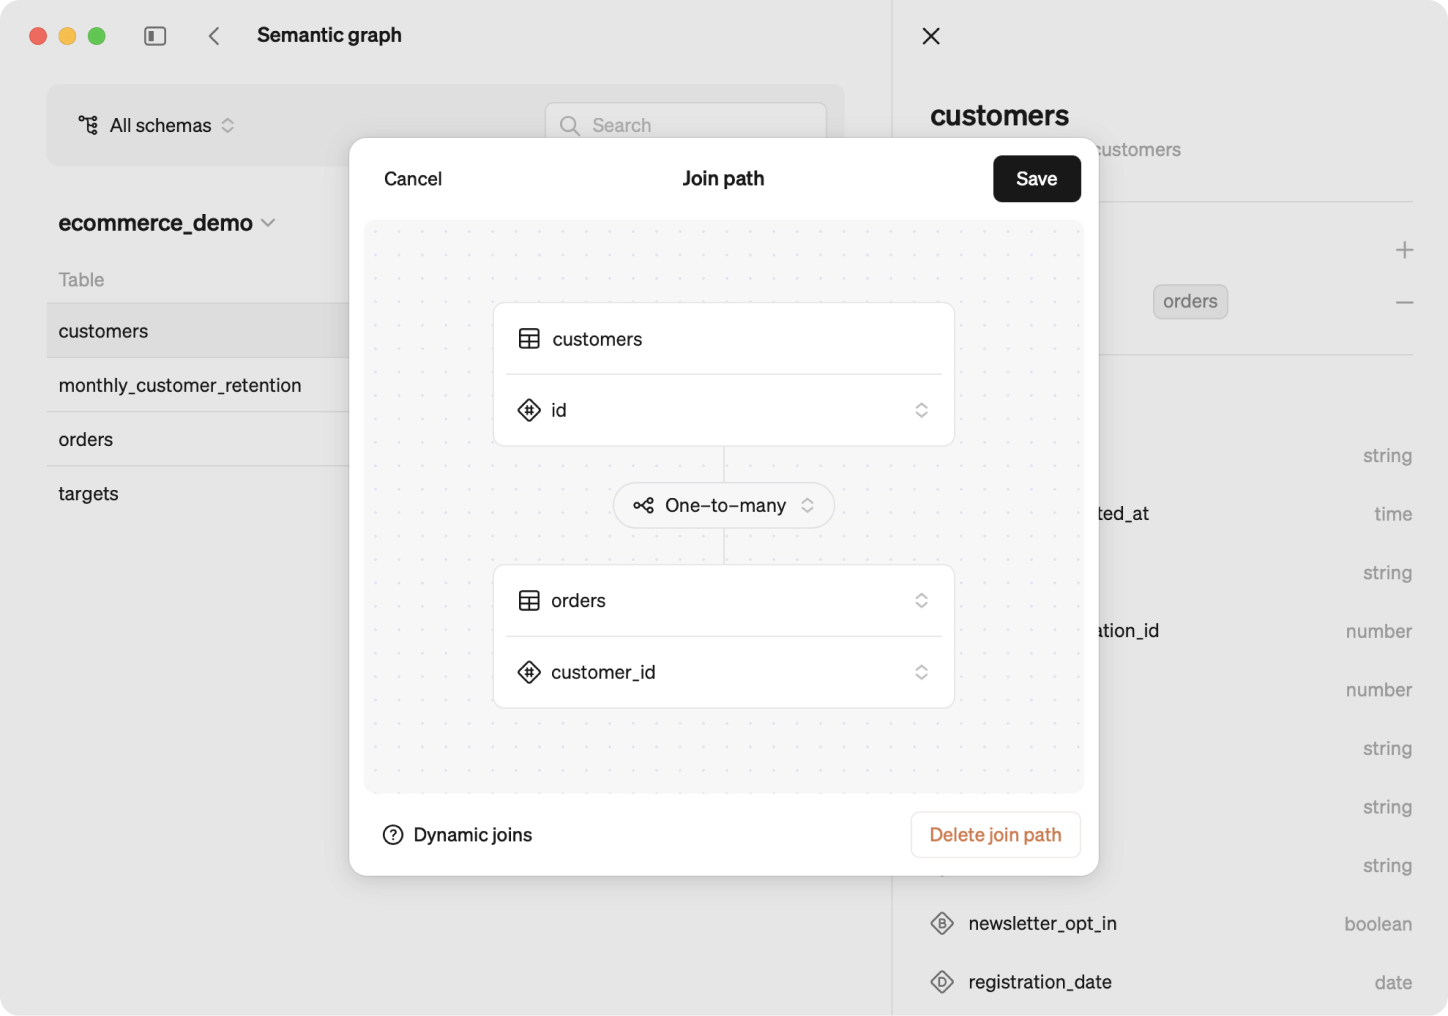
Say hello to the semantic graph
The semantic graph is a dynamic way to define data relations across tables, making creating and updating metrics easier than ever. It also let’s you connect entities to metrics built from different tables.
Why it's a game-changer:
- Dynamic joins: Only necessary tables are queried with the semantic graph, making querying more time and cost-efficient.
- Powerful definitions: Define metrics and entities across multiple tables without relying on static joins.
- Scalability: Easily edit metrics, entities and the semantic graph as your business and database evolve.
Learn more about semantic graph →
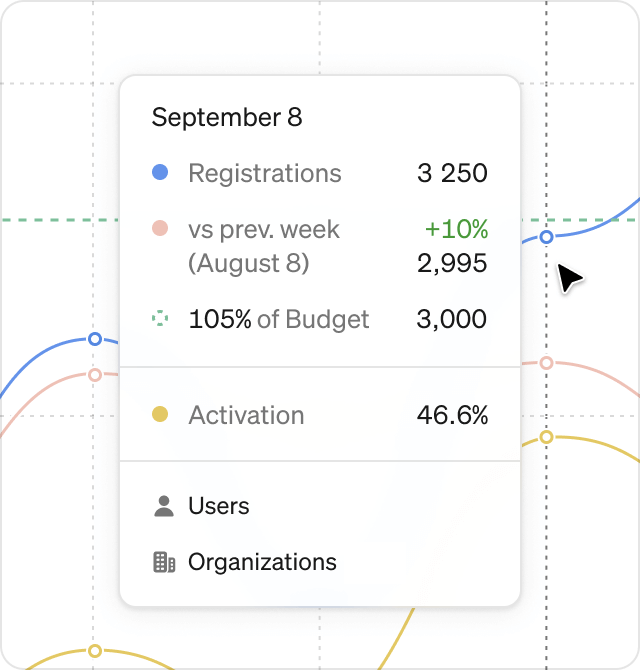
A more intuitive way to view chart numbers
We’ve updated our tooltip for all charts in explore and reports. Hover over any chart to see the numbers in a convenient popover. Want to dig deeper? Just click to freeze the popover and analyze the details quickly.
Book a demo
Get help with exploring the platform and discussing use cases for your team.
Get started
Explore for free. Get your own workspace or try the demo setup.
More posts

Intro to Steep
By Janna Pollari·Events

Webinar with Daana
By Janna Pollari·Events

Meet us at Snowflake Summit 2026
By Deanne Anderson·Events
Introducing Steep AI
By Nino Höglund·Product

A builder's guide to the Steep API
By Hanna Kjellén·Inside Steep
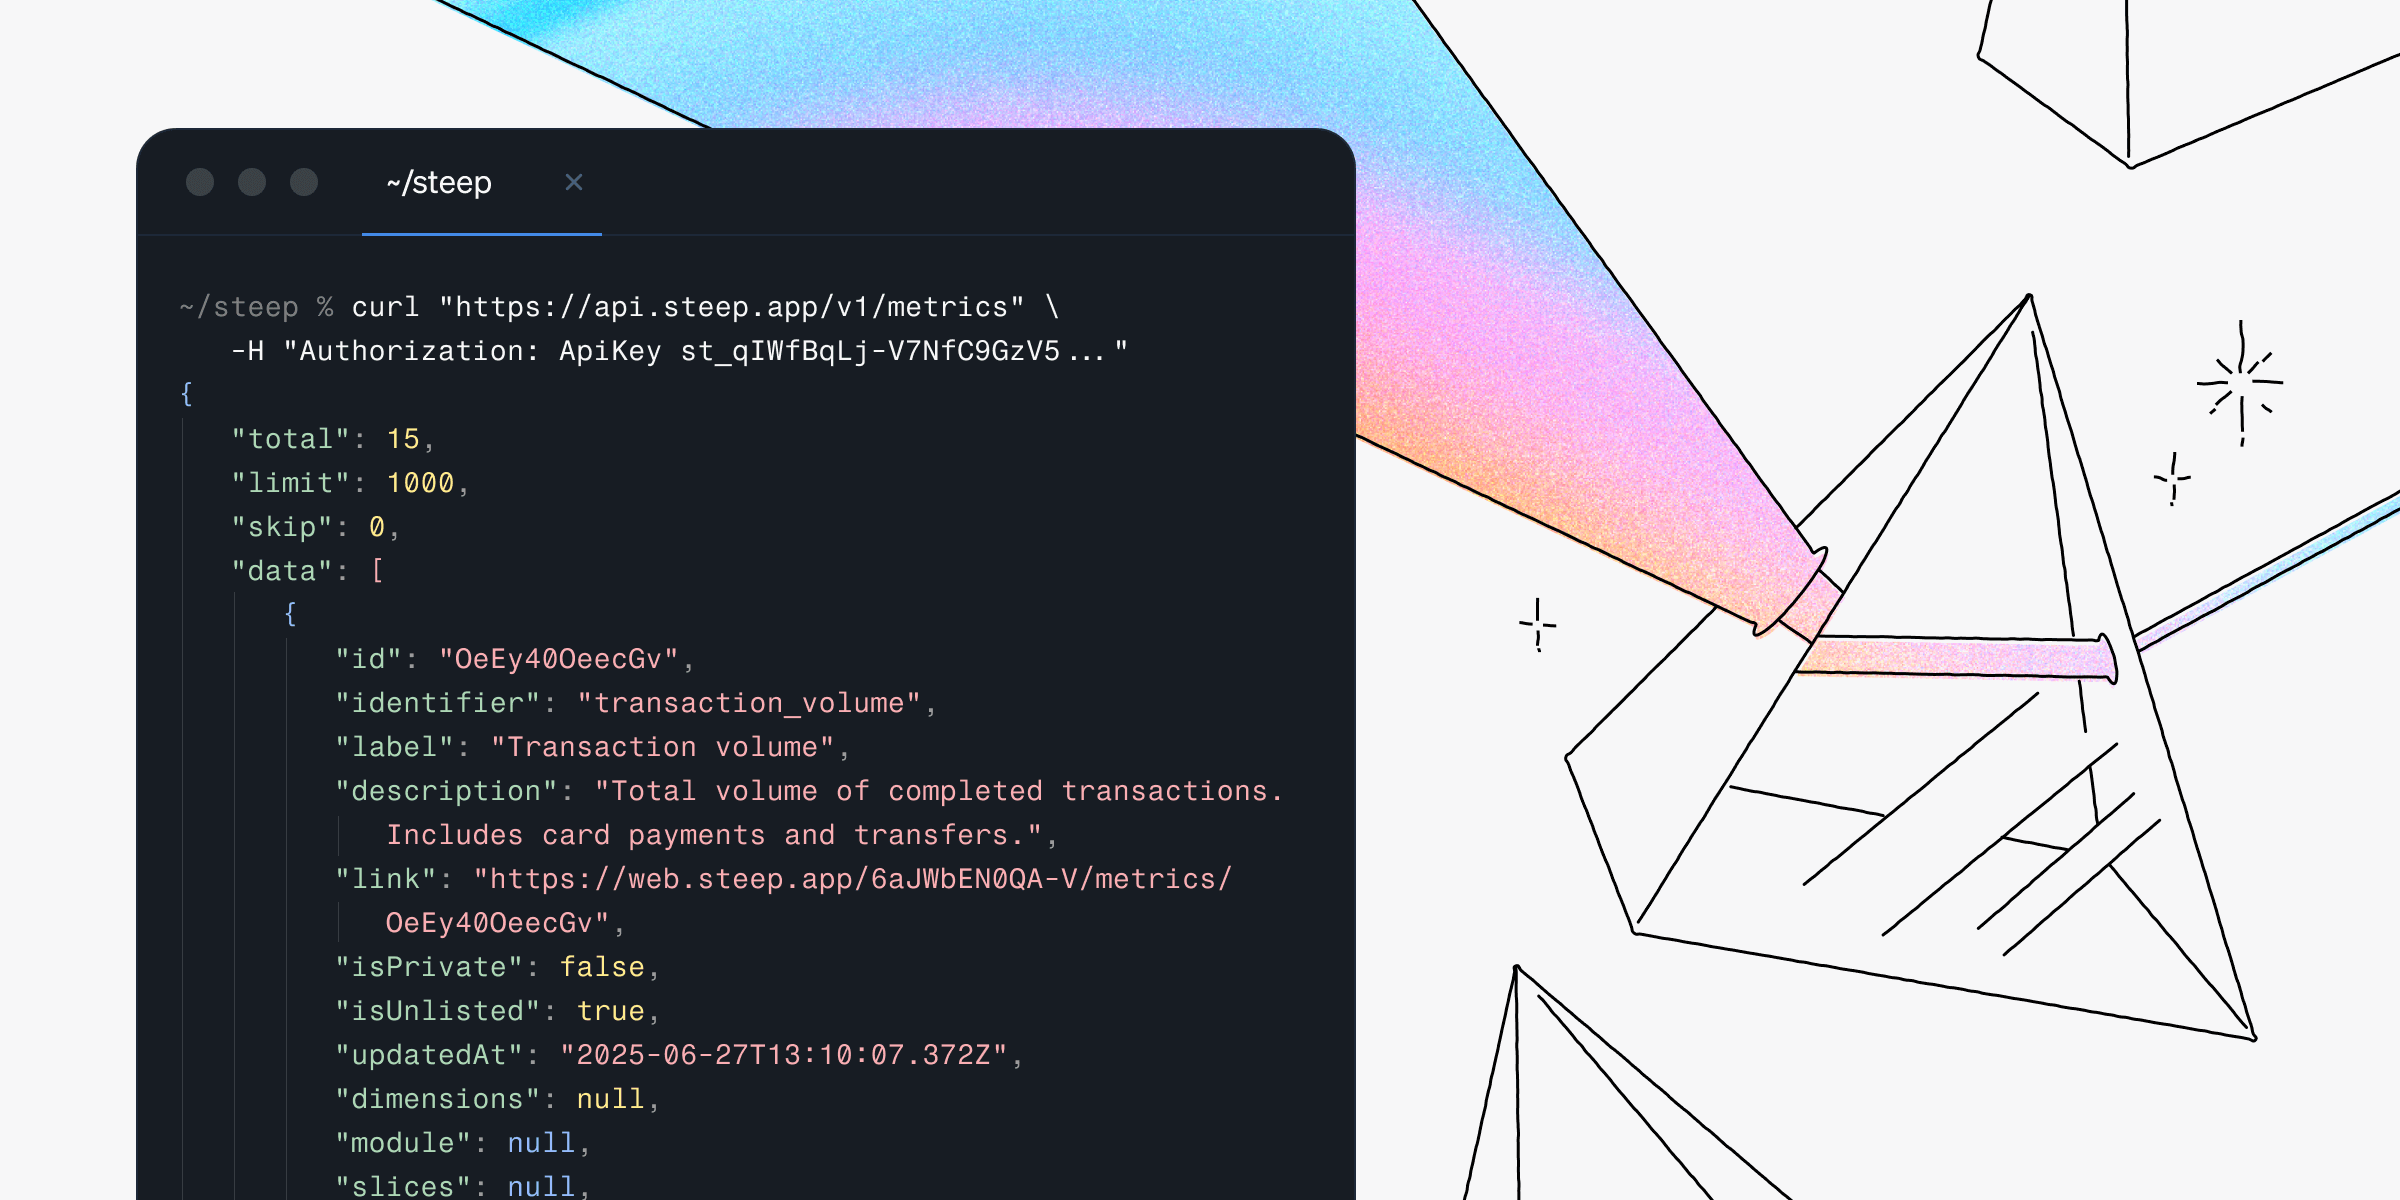
New in Steep: API – Metrics power anything
By Nino Höglund·Product