This month, we’re excited to introduce cohorts! What was previously reserved for experts can now be built by anyone. Track how different groups of users behave over time and easily spot patterns in our latest visualization update.

Exploring cohorts
Once you have a cohort defined, anyone in the workspace can start using it, saving your data team time on building cohort analysis from scratch repeatedly.
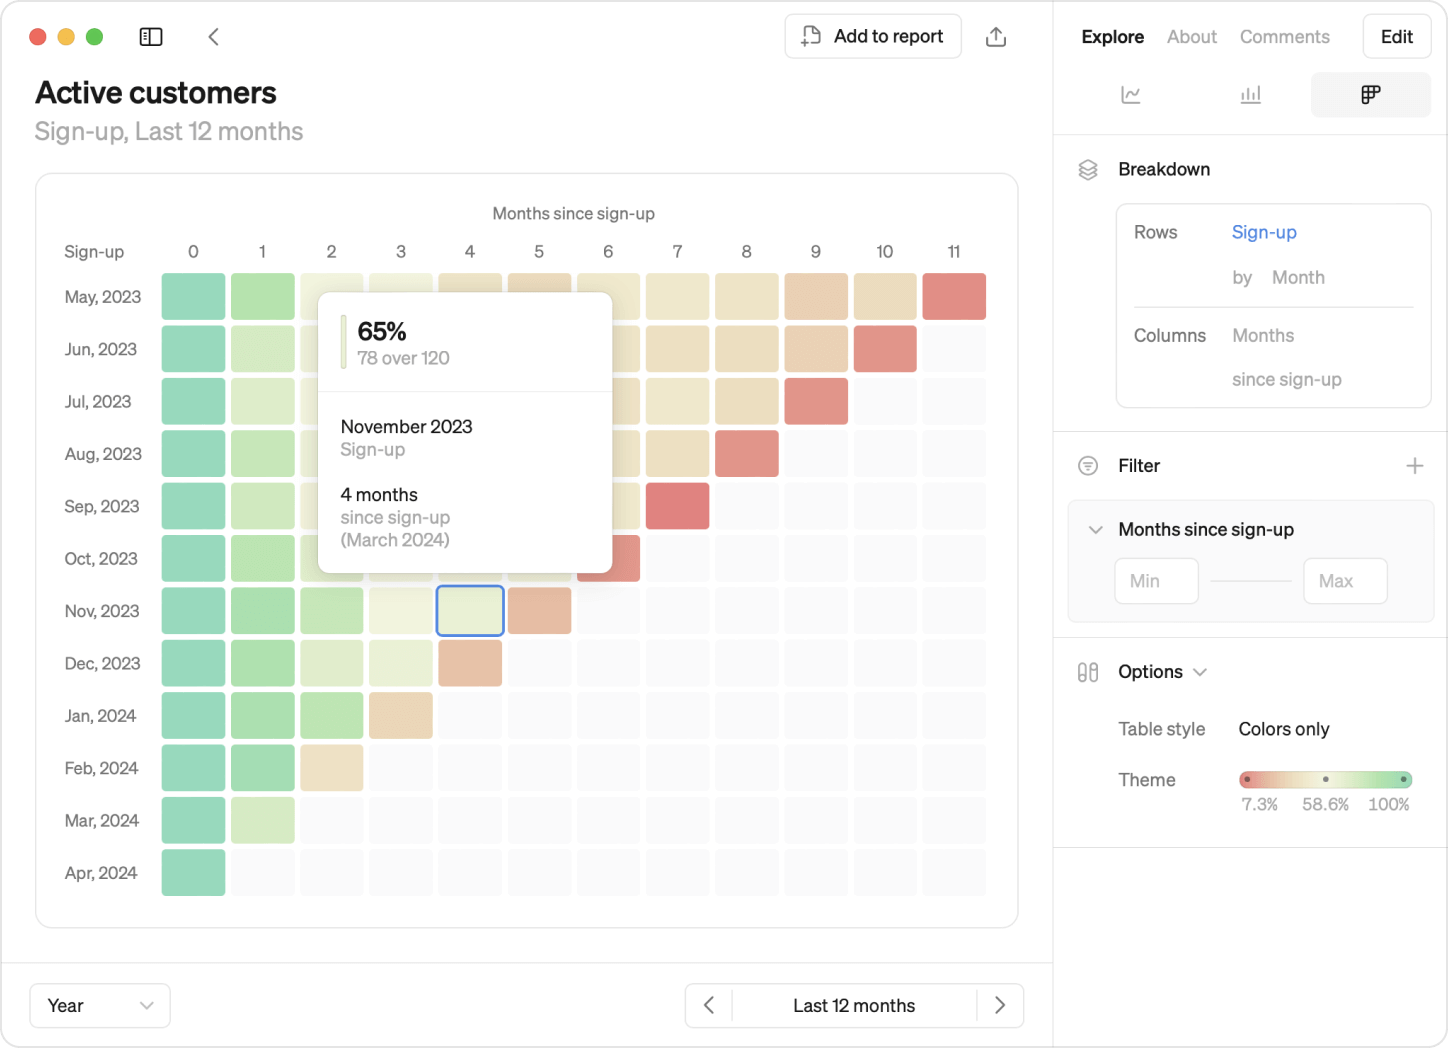
What’s unique about cohorts is how many different ways you can gain insights:
- Row-by-row: Each row unveils user group behavior over time, revealing retention trends and drop-off points.
- Comparative analysis: Comparing rows illuminates product lifecycle dynamics, highlighting differences between your early and more recent adopters.
- Detecting patterns: Diagonal patterns indicate seasonality or significant events, giving you insights into how these affect your newer and older users.
Just like Steeps other visualizations you can:
- Break down by start date or dimension, adjusting granularity for deeper analysis.
- Apply filters to cohorts for focused examination.
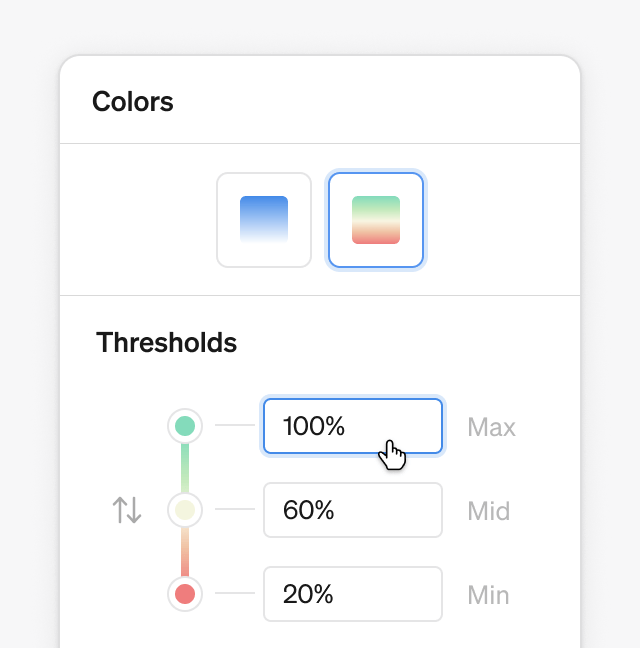
- Customize color thresholds to spot patterns or emphasize insights with a choice of two themes: monochrome or red-yellow-green.
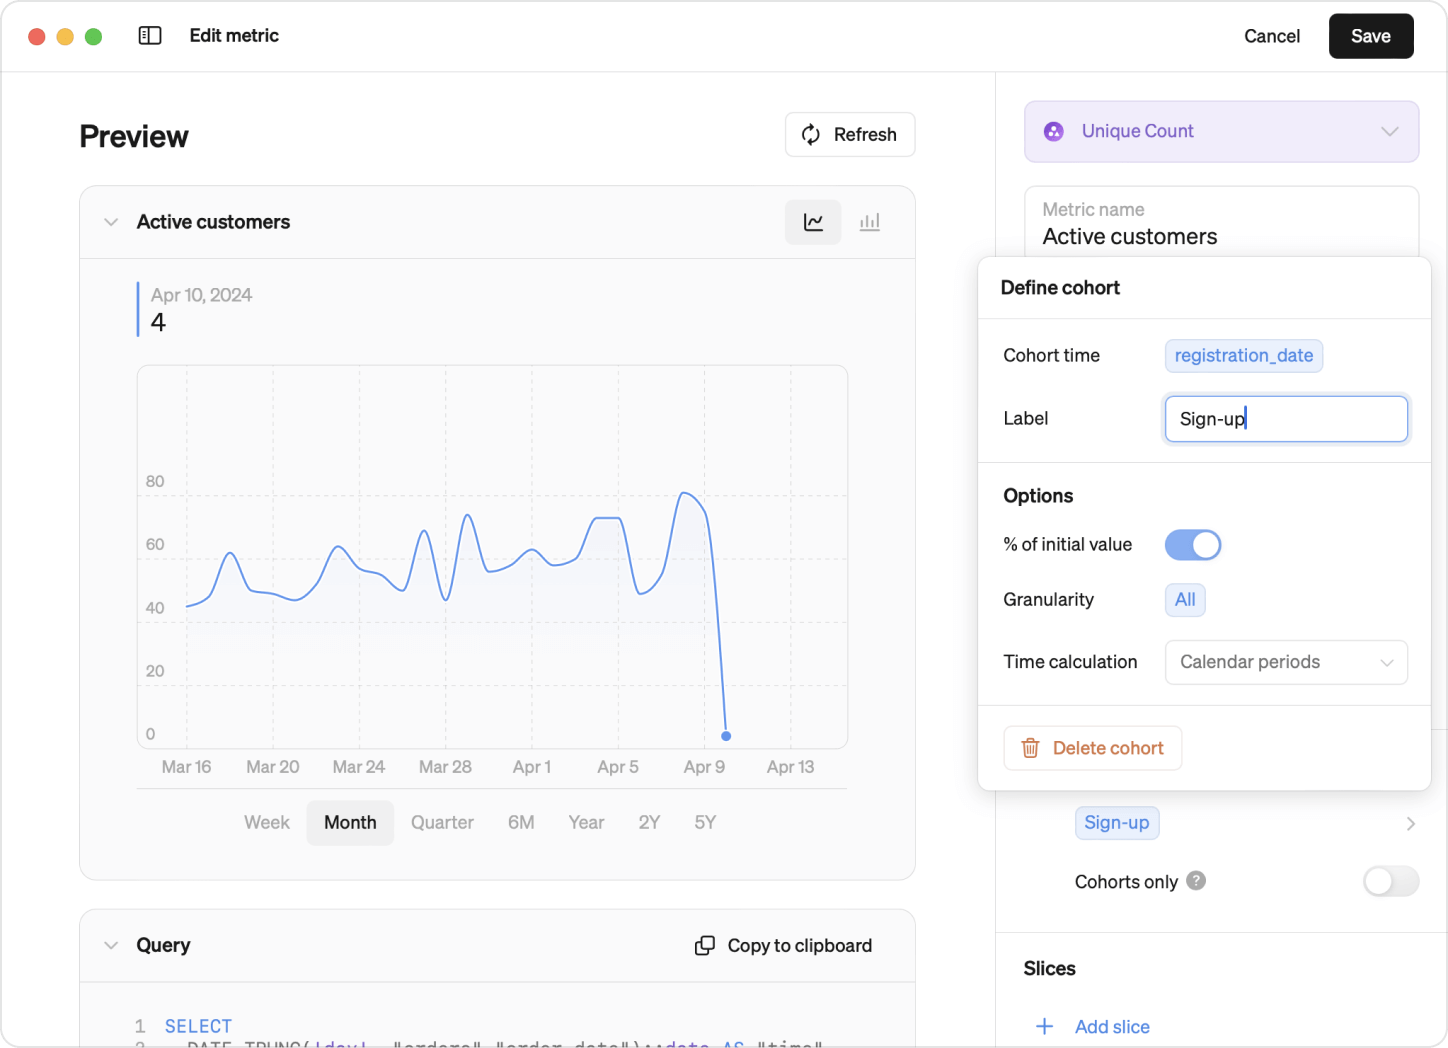
Defining cohorts
In Steep, there are two ways of defining cohorts: Standard and Advanced. Once defined, all members can start exploring them, just like other visualizations in Steep.
- Standard cohorts: Easily define cohorts from your existing tables, dynamically calculated for quick insights. No adjustments to your data structure required.
- Advanced Cohorts: Built from tables explicitly created for cohorts, supporting more complex analyses like advanced retention cohorts.
With Steep's intuitive interface, defining and exploring cohorts is a breeze. Whether you're a seasoned analyst or just starting your data journey.

Databricks integration
Also new this month: We have now launched our Databricks integration public beta! Connect Steep directly to your Databricks database and start analyzing your metrics today.
Product overview
Looking for a quick and easy way to learn about Steep? Our new product overview video has everything you need to get started.
Book a demo
Get help with exploring the platform and discussing use cases for your team.
Get started
Explore for free. Get your own workspace or try the demo setup.
More posts

Intro to Steep
By Janna Pollari·Events
Webinar with Daana
By Janna Pollari·Events

Meet us at Snowflake Summit 2026
By Deanne Anderson·Events
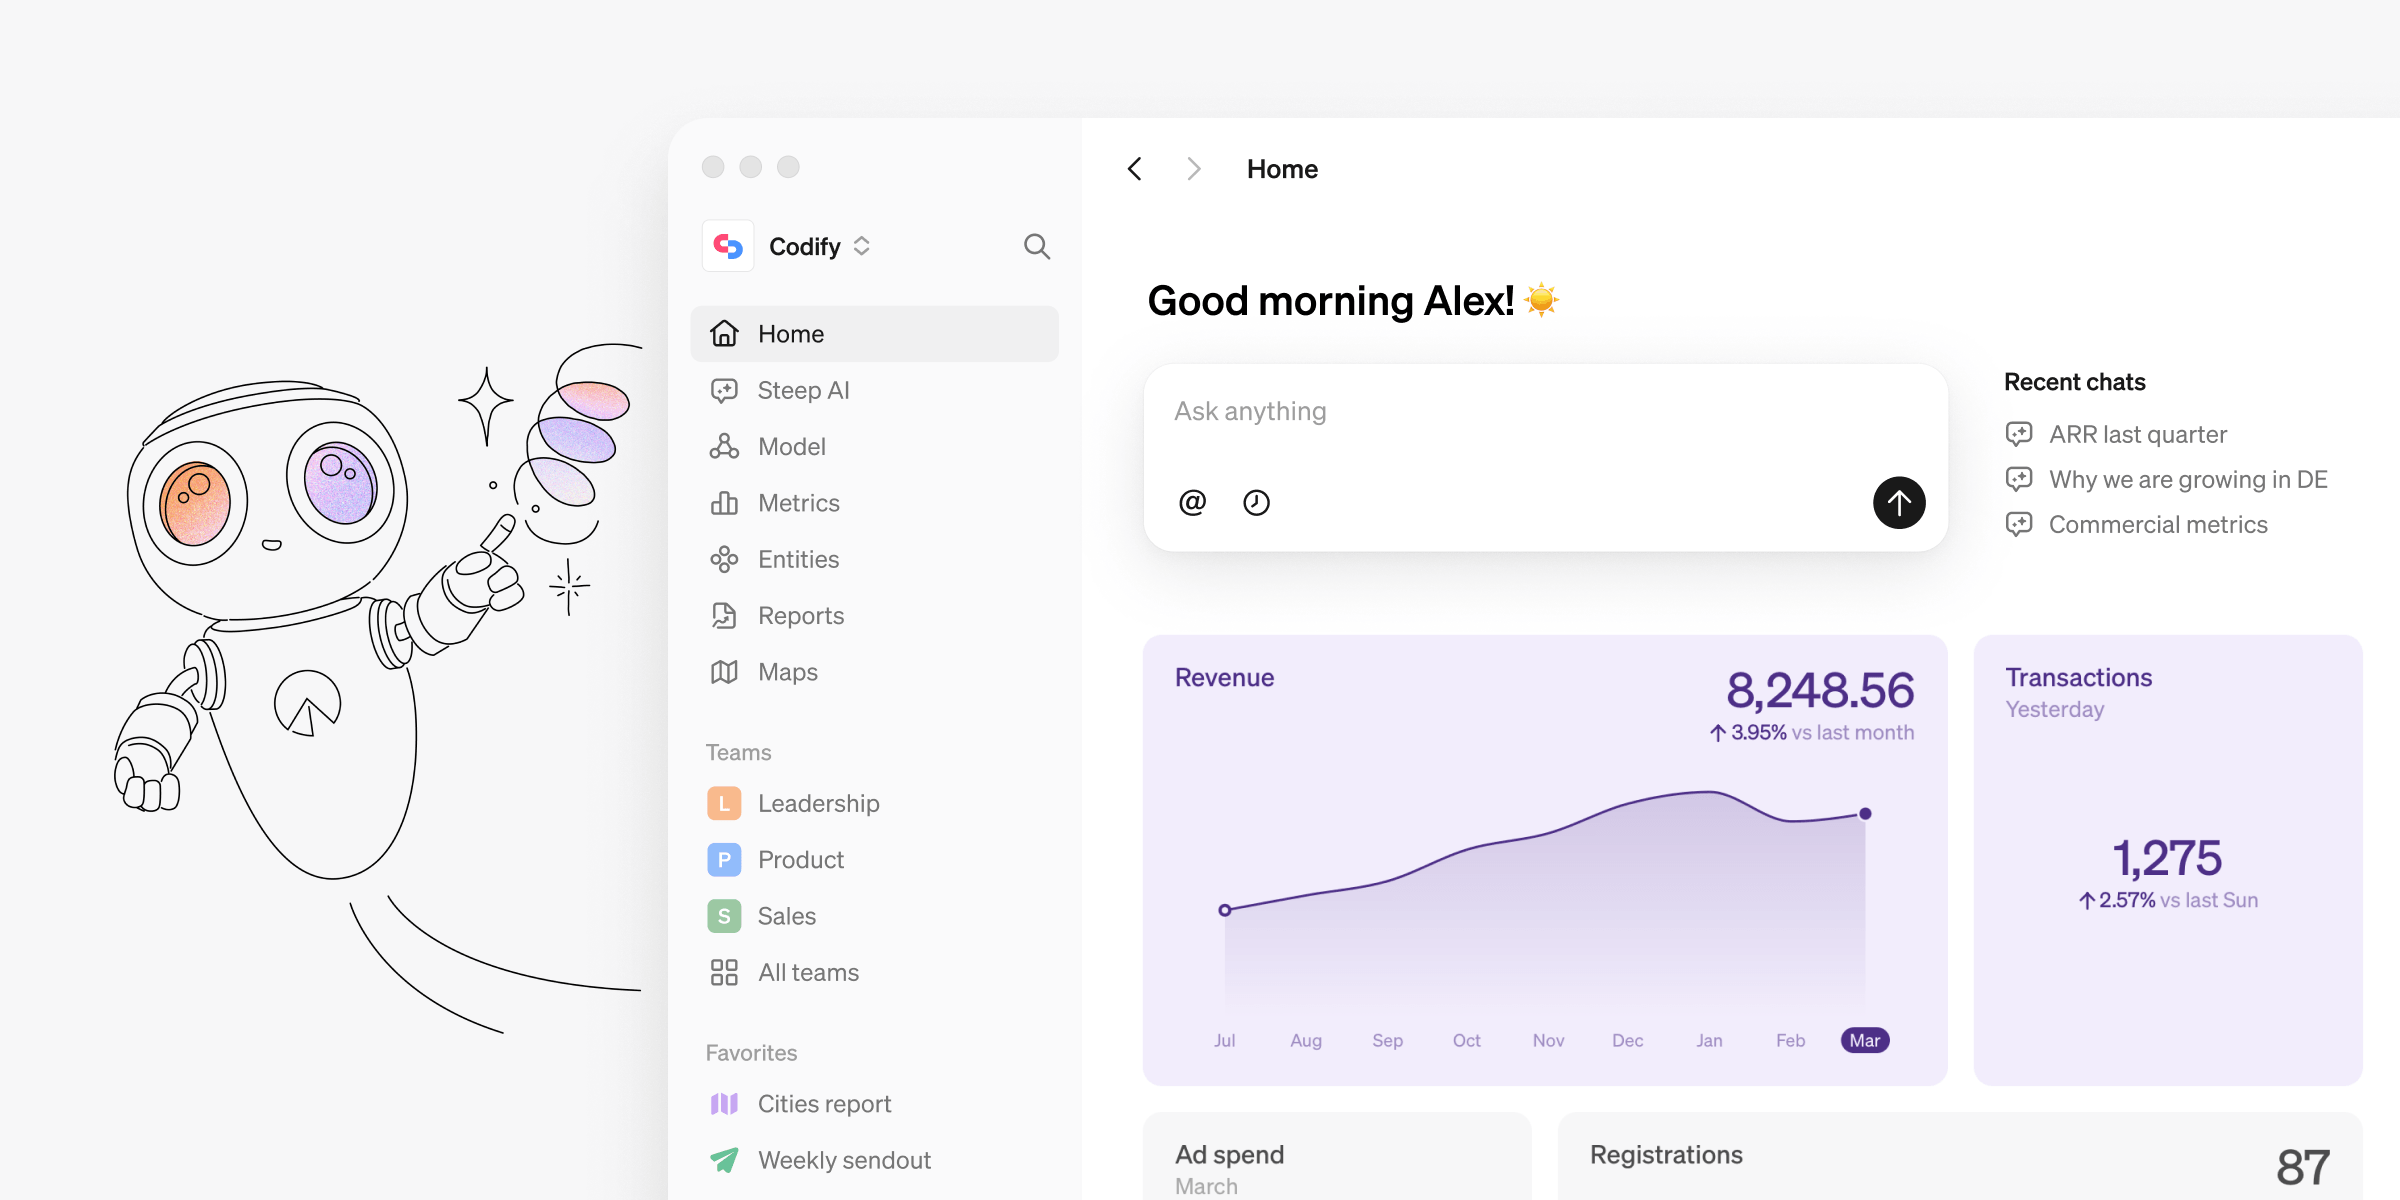
Introducing Steep AI
By Nino Höglund·Product

A builder's guide to the Steep API
By Hanna Kjellén·Inside Steep
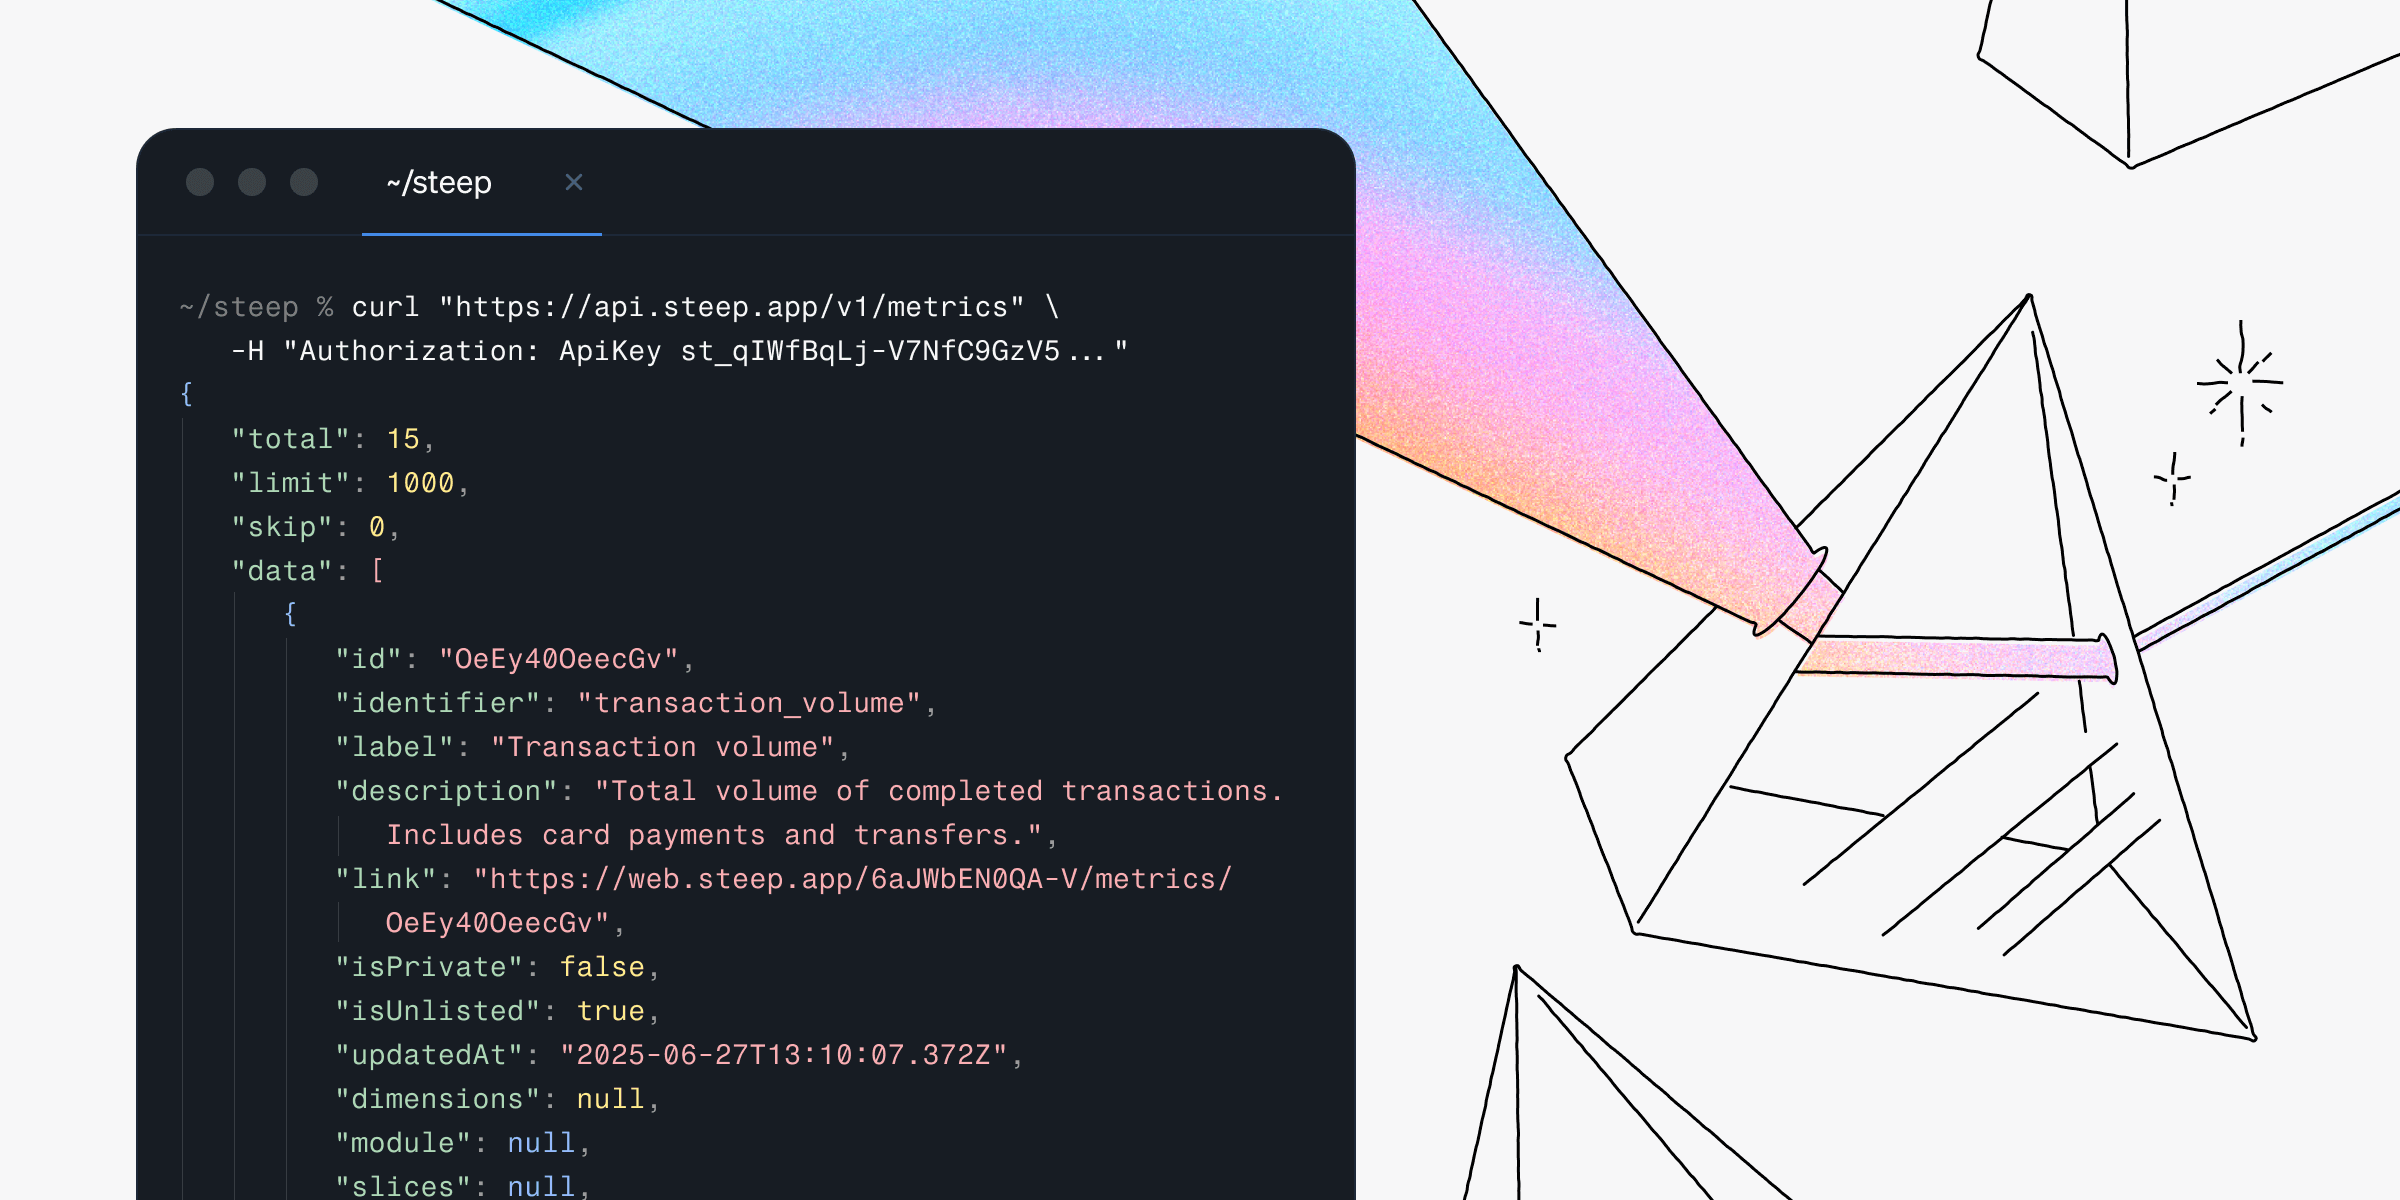
New in Steep: API – Metrics power anything
By Nino Höglund·Product