
Our latest product updates are designed to simplify your workflow and make everyday tasks a breeze. Here’s how we’re addressing your most requested improvements:

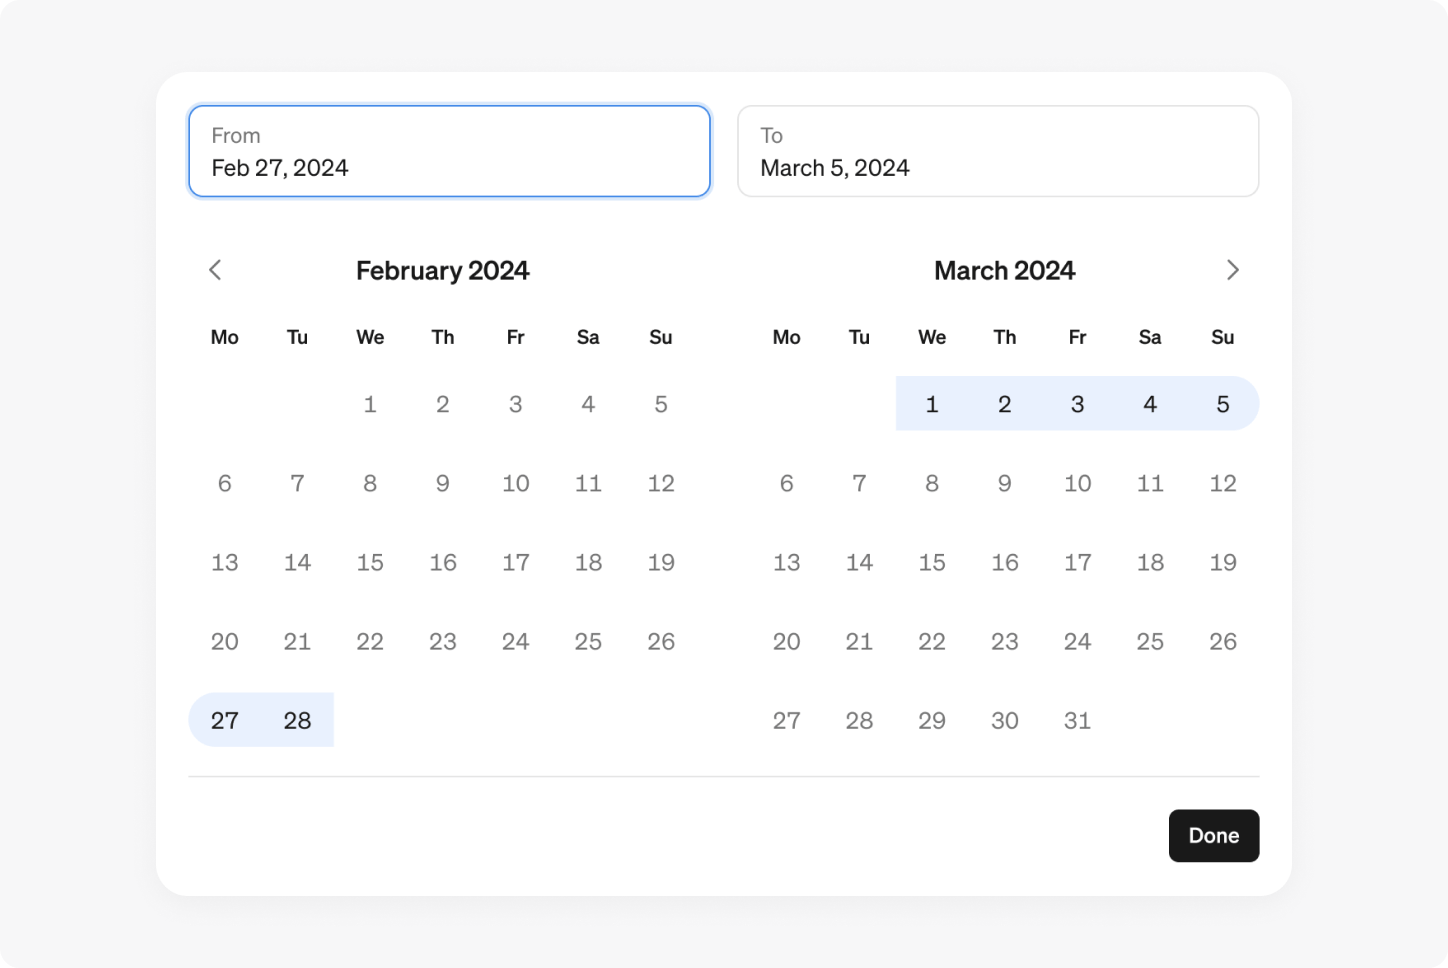
Custom date ranges
Now, you can select a custom date range when exploring metrics and reports. Custom date ranges are available the explore view, filters, tables and report filters. Whenever you select a time range in Steep, you now have the option to set any start and end date.
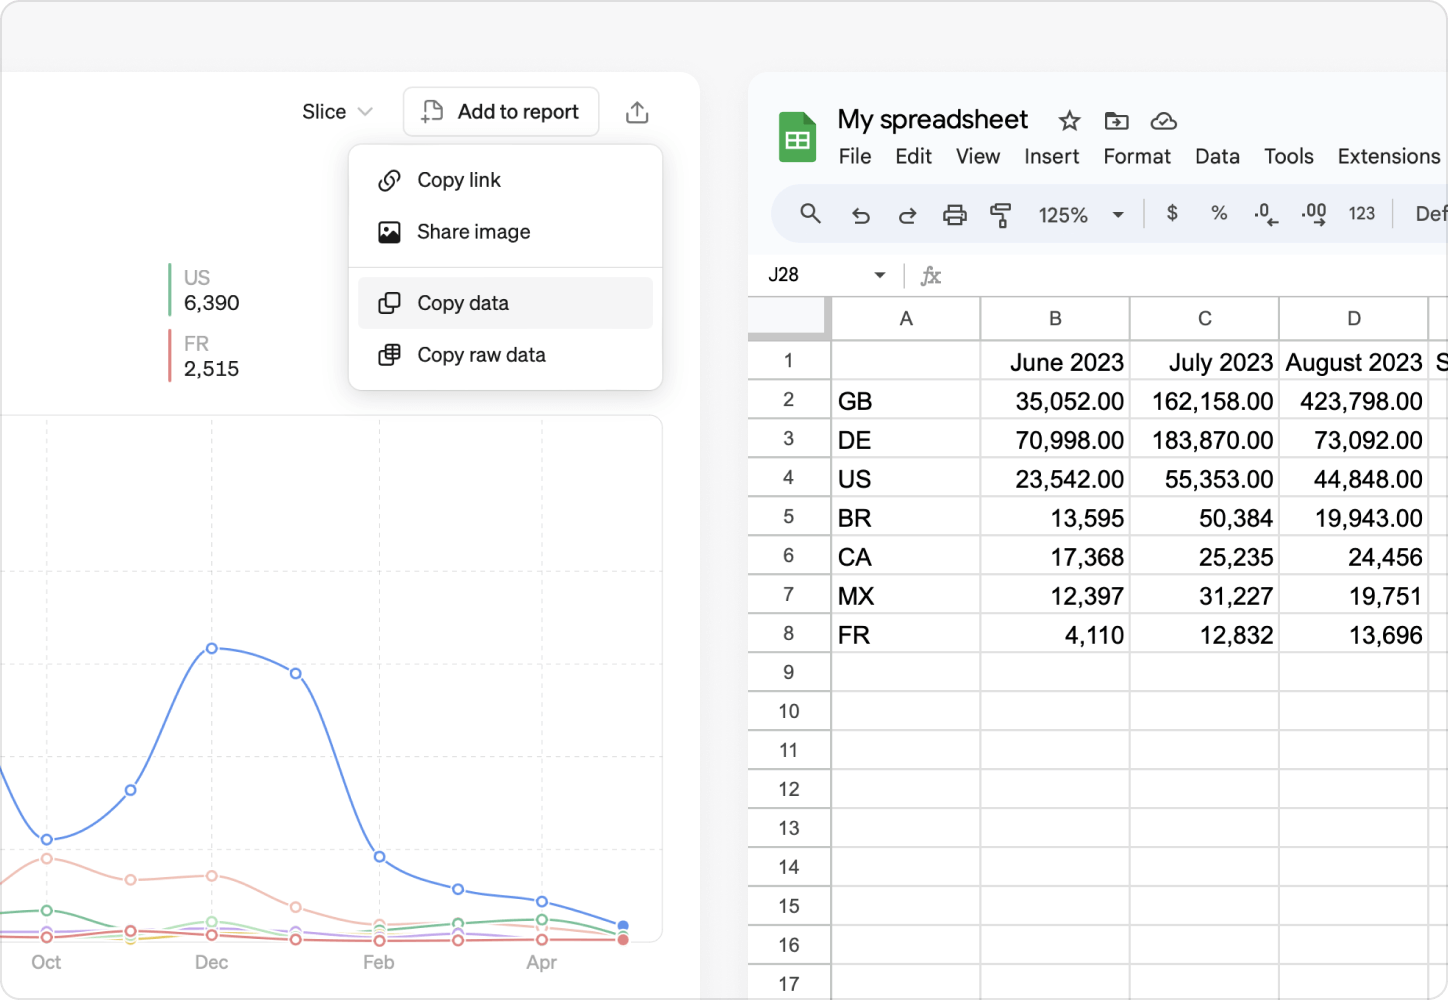
Copy data
Copying data is now easier than ever, allowing you to seamlessly copy data to external tools like Google Sheets or Excel. You can copy data for any metric in the share menu, chart block, or table in a report. All comparisons, targets, and breakdowns are included.
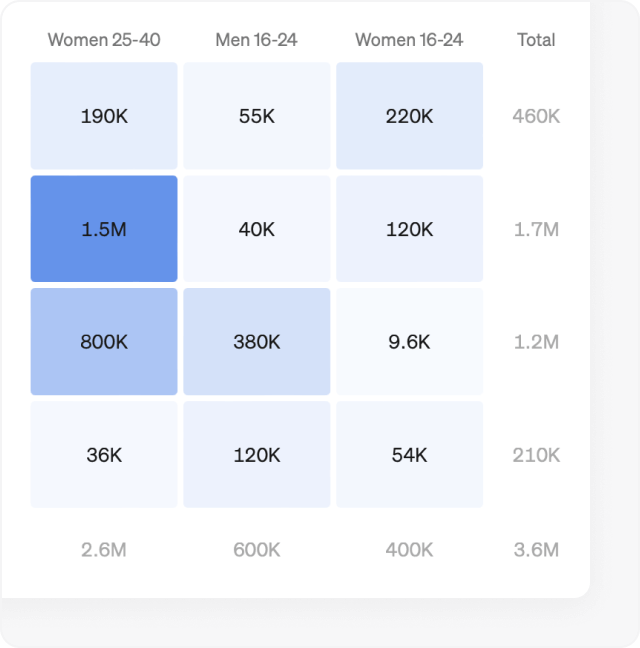
Pivot table totals
You can now display totals for columns, rows, or both, giving you a quick overview of overall performance and trends. You can enable it in the Options section.
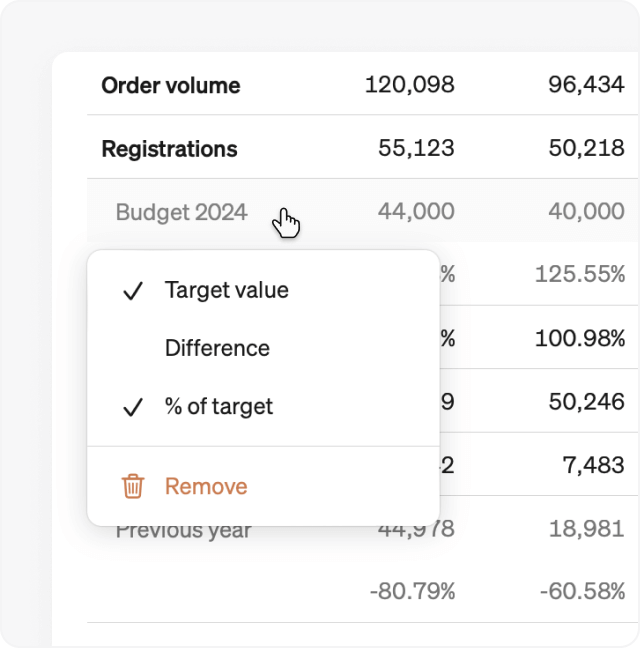
Table comparison rows
Our new table comparison rows let you add the absolute difference and percentage change of a metric compared to previous periods or targets. Add a comparison or target to a table and click it to find the new options.
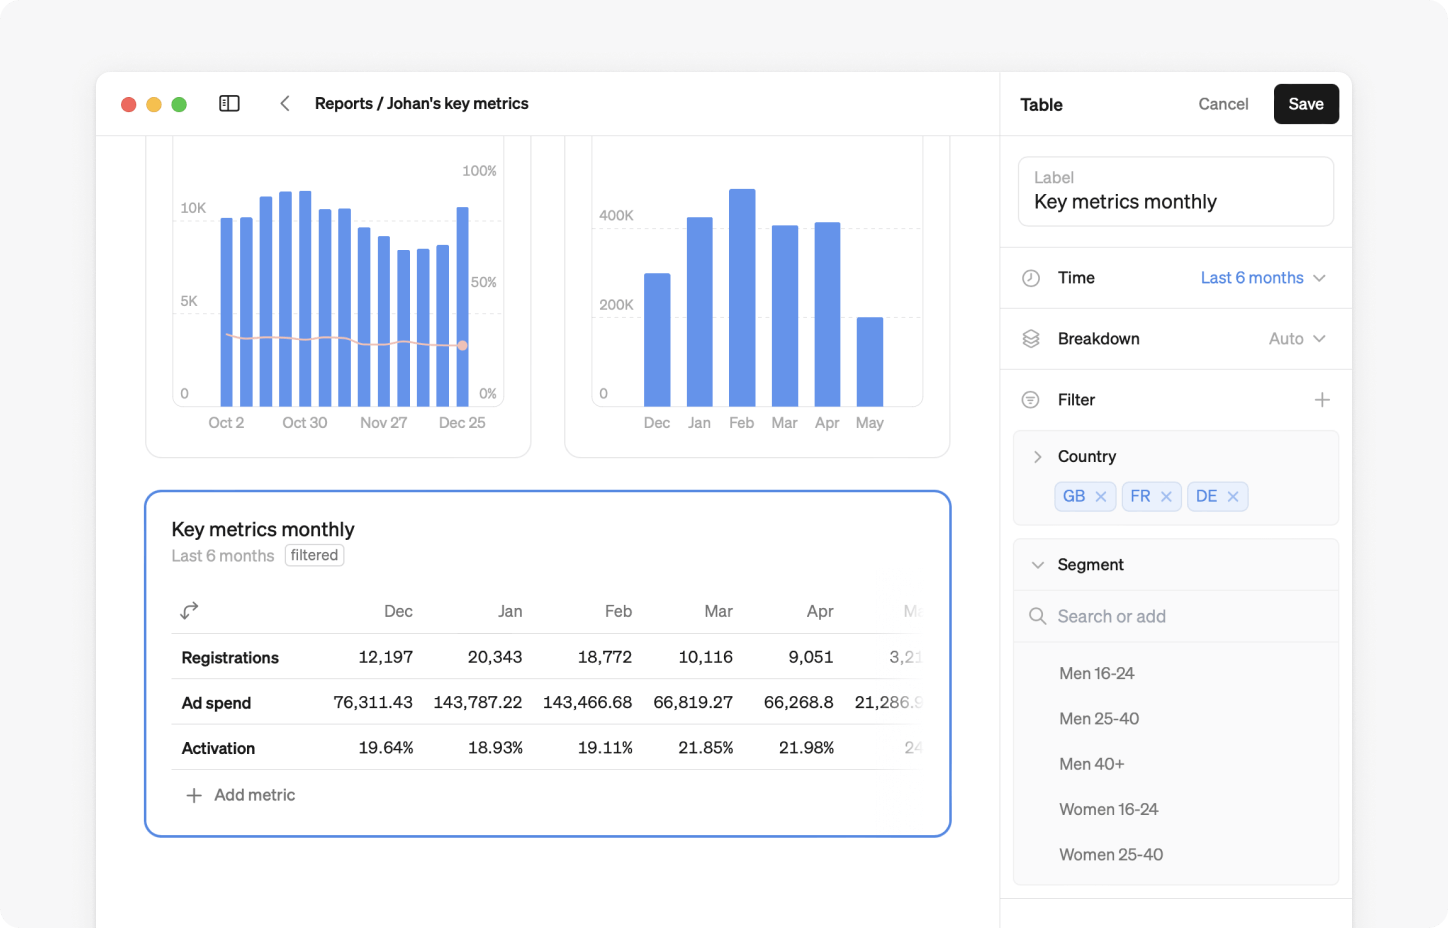
Table filters
You can now add individual filters directly to any table in reports. Simply click the edit icon in the top right-hand corner of your table. Then, under the filter drop-down menu, select the dimensions you want to use.
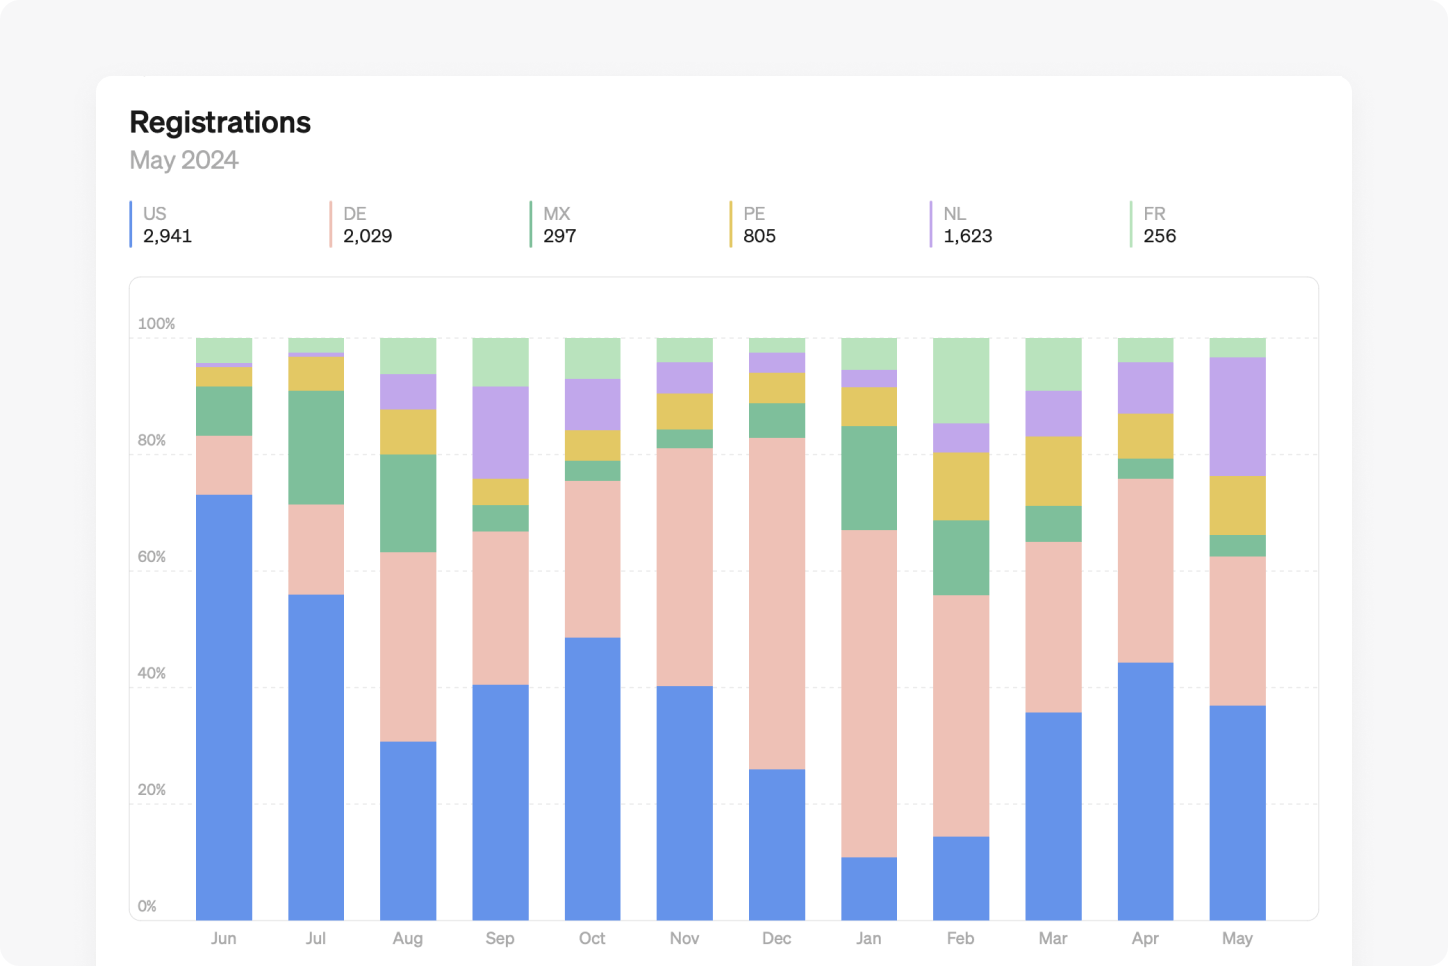
100% stacked bars
Introducing 100% stacked bar charts, a powerful update to our bar chart visualization. These charts are particularly useful when you want to understand how each dimension of a metric contributes to the whole over time. Find it in the Breakdown section of any bar chart.
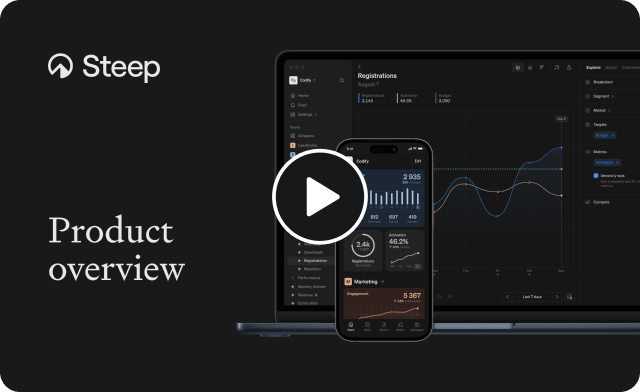
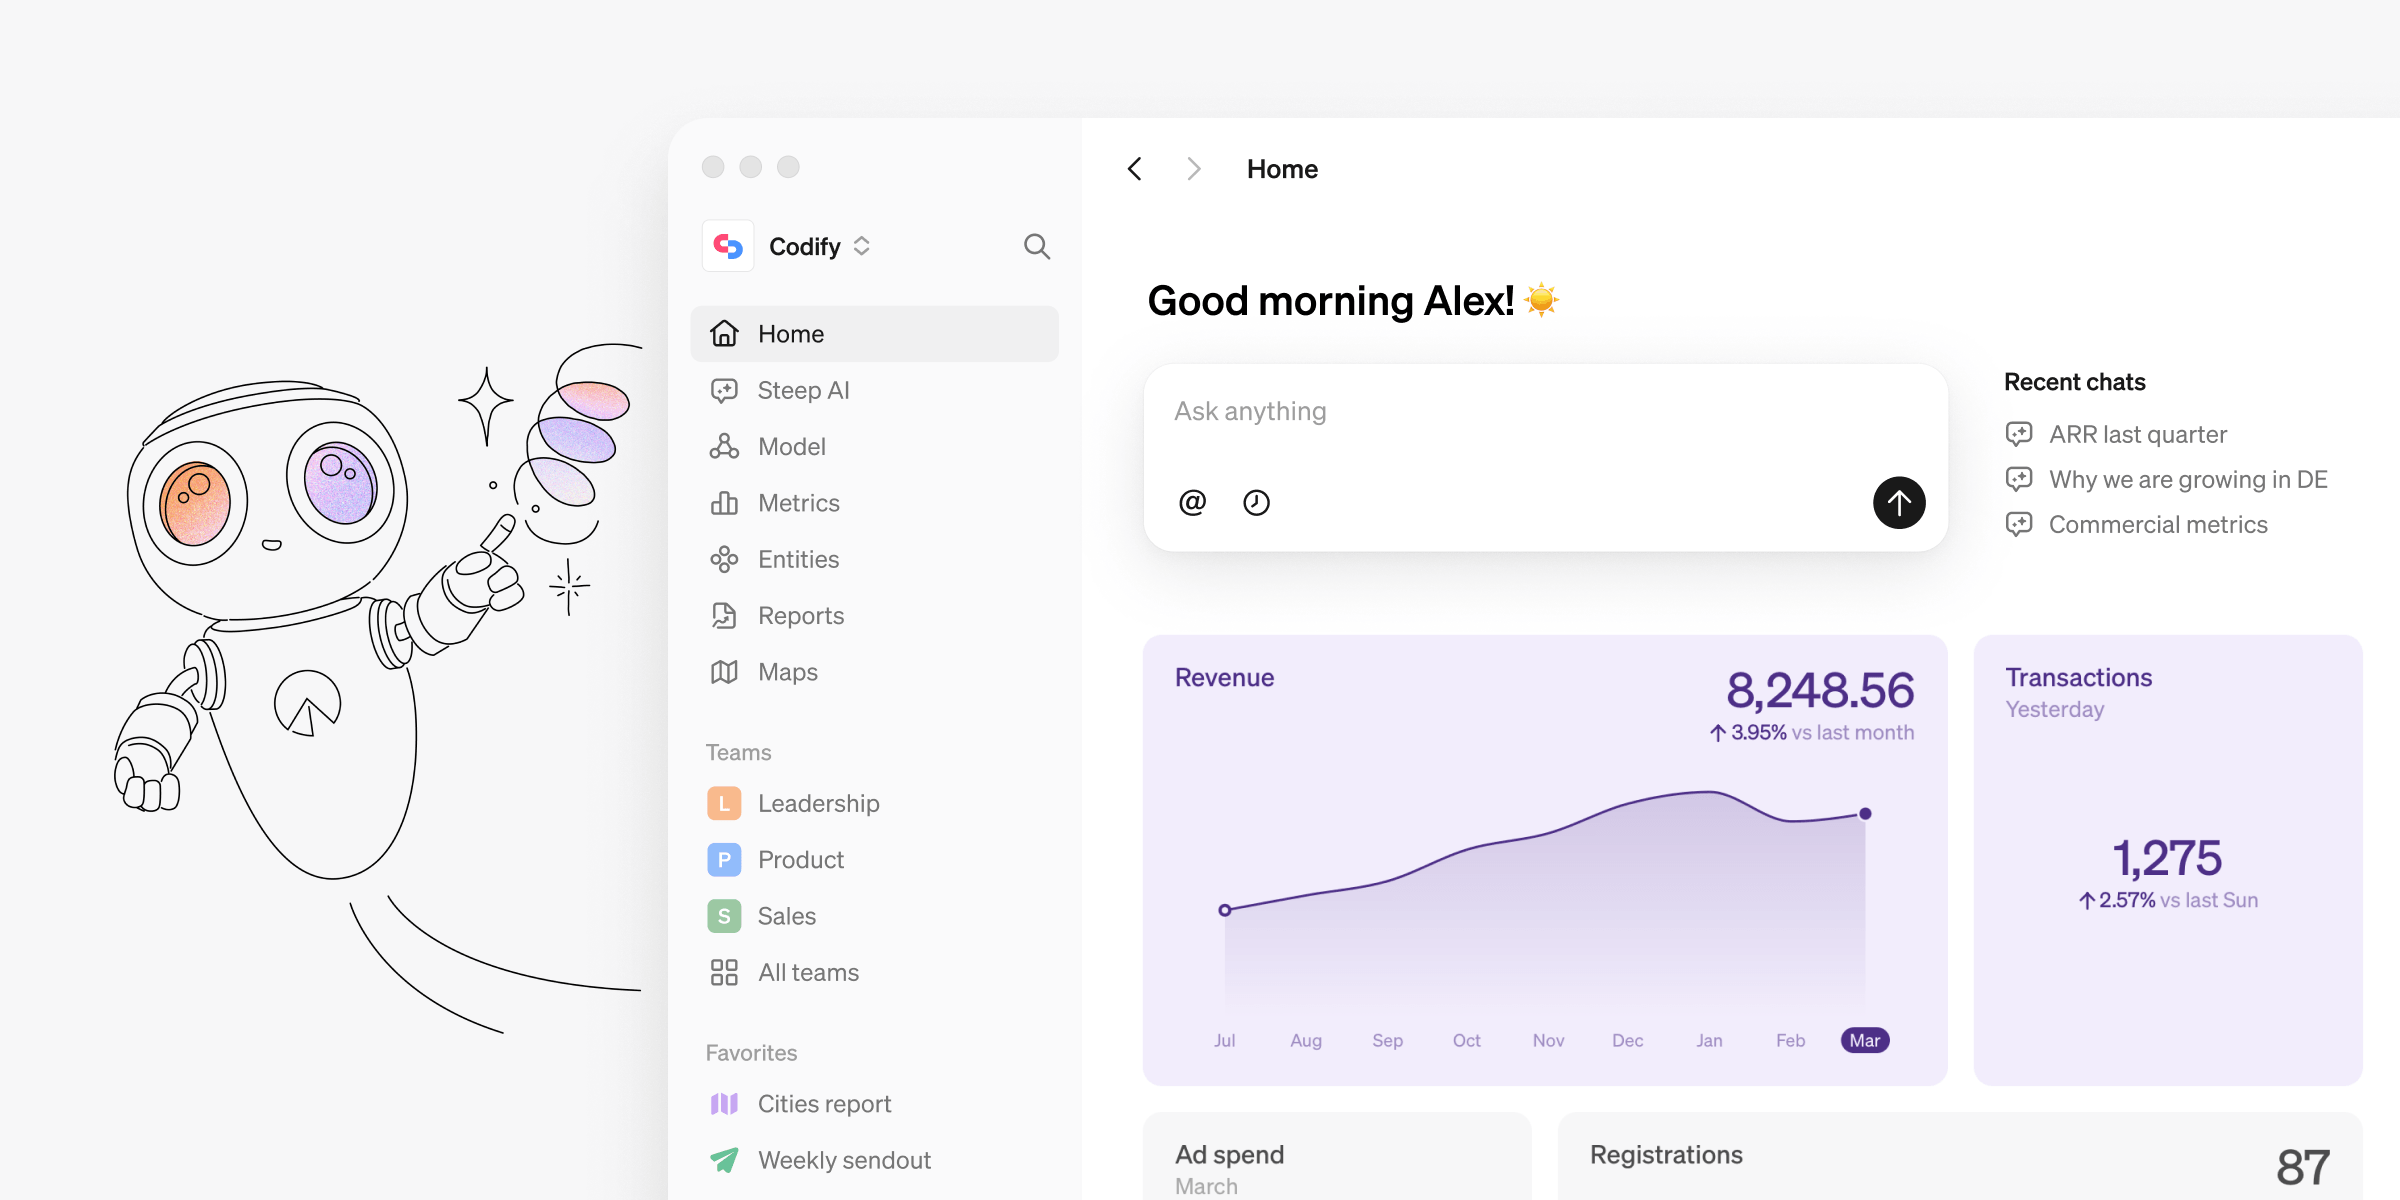
Product overview
Looking for a quick and easy way to learn about Steep? Our new product overview video has everything you need to get started.
Book a demo
Get help with exploring the platform and discussing use cases for your team.
Get started
Explore for free. Get your own workspace or try the demo setup.
More posts

Intro to Steep
By Janna Pollari·Events
Webinar with Daana
By Janna Pollari·Events

Meet us at Snowflake Summit 2026
By Deanne Anderson·Events
Introducing Steep AI
By Nino Höglund·Product

A builder's guide to the Steep API
By Hanna Kjellén·Inside Steep
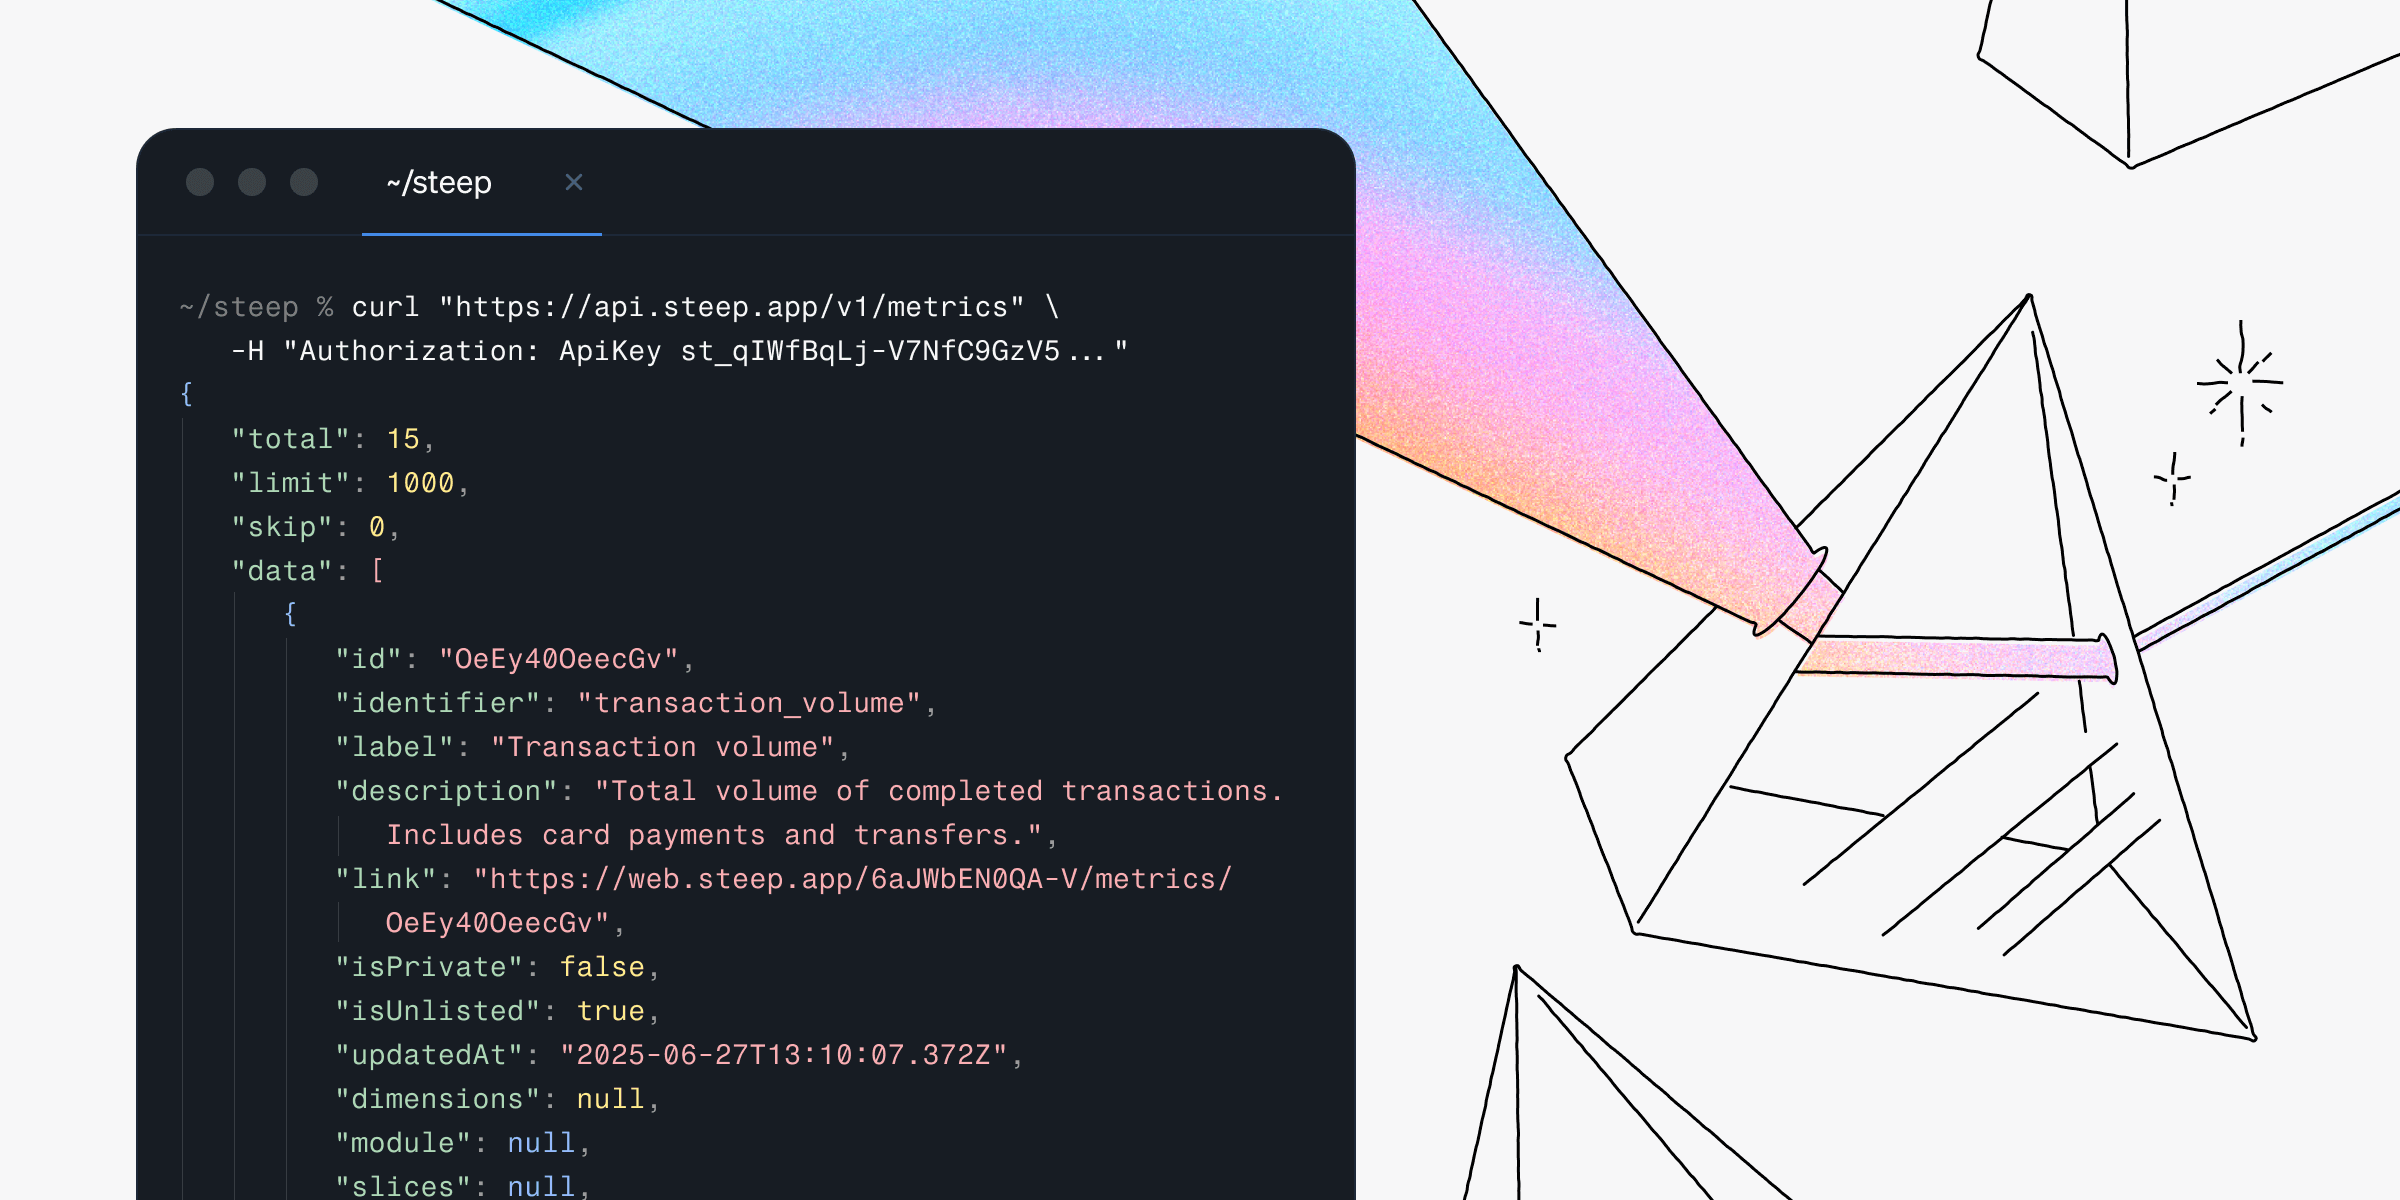
New in Steep: API – Metrics power anything
By Nino Höglund·Product