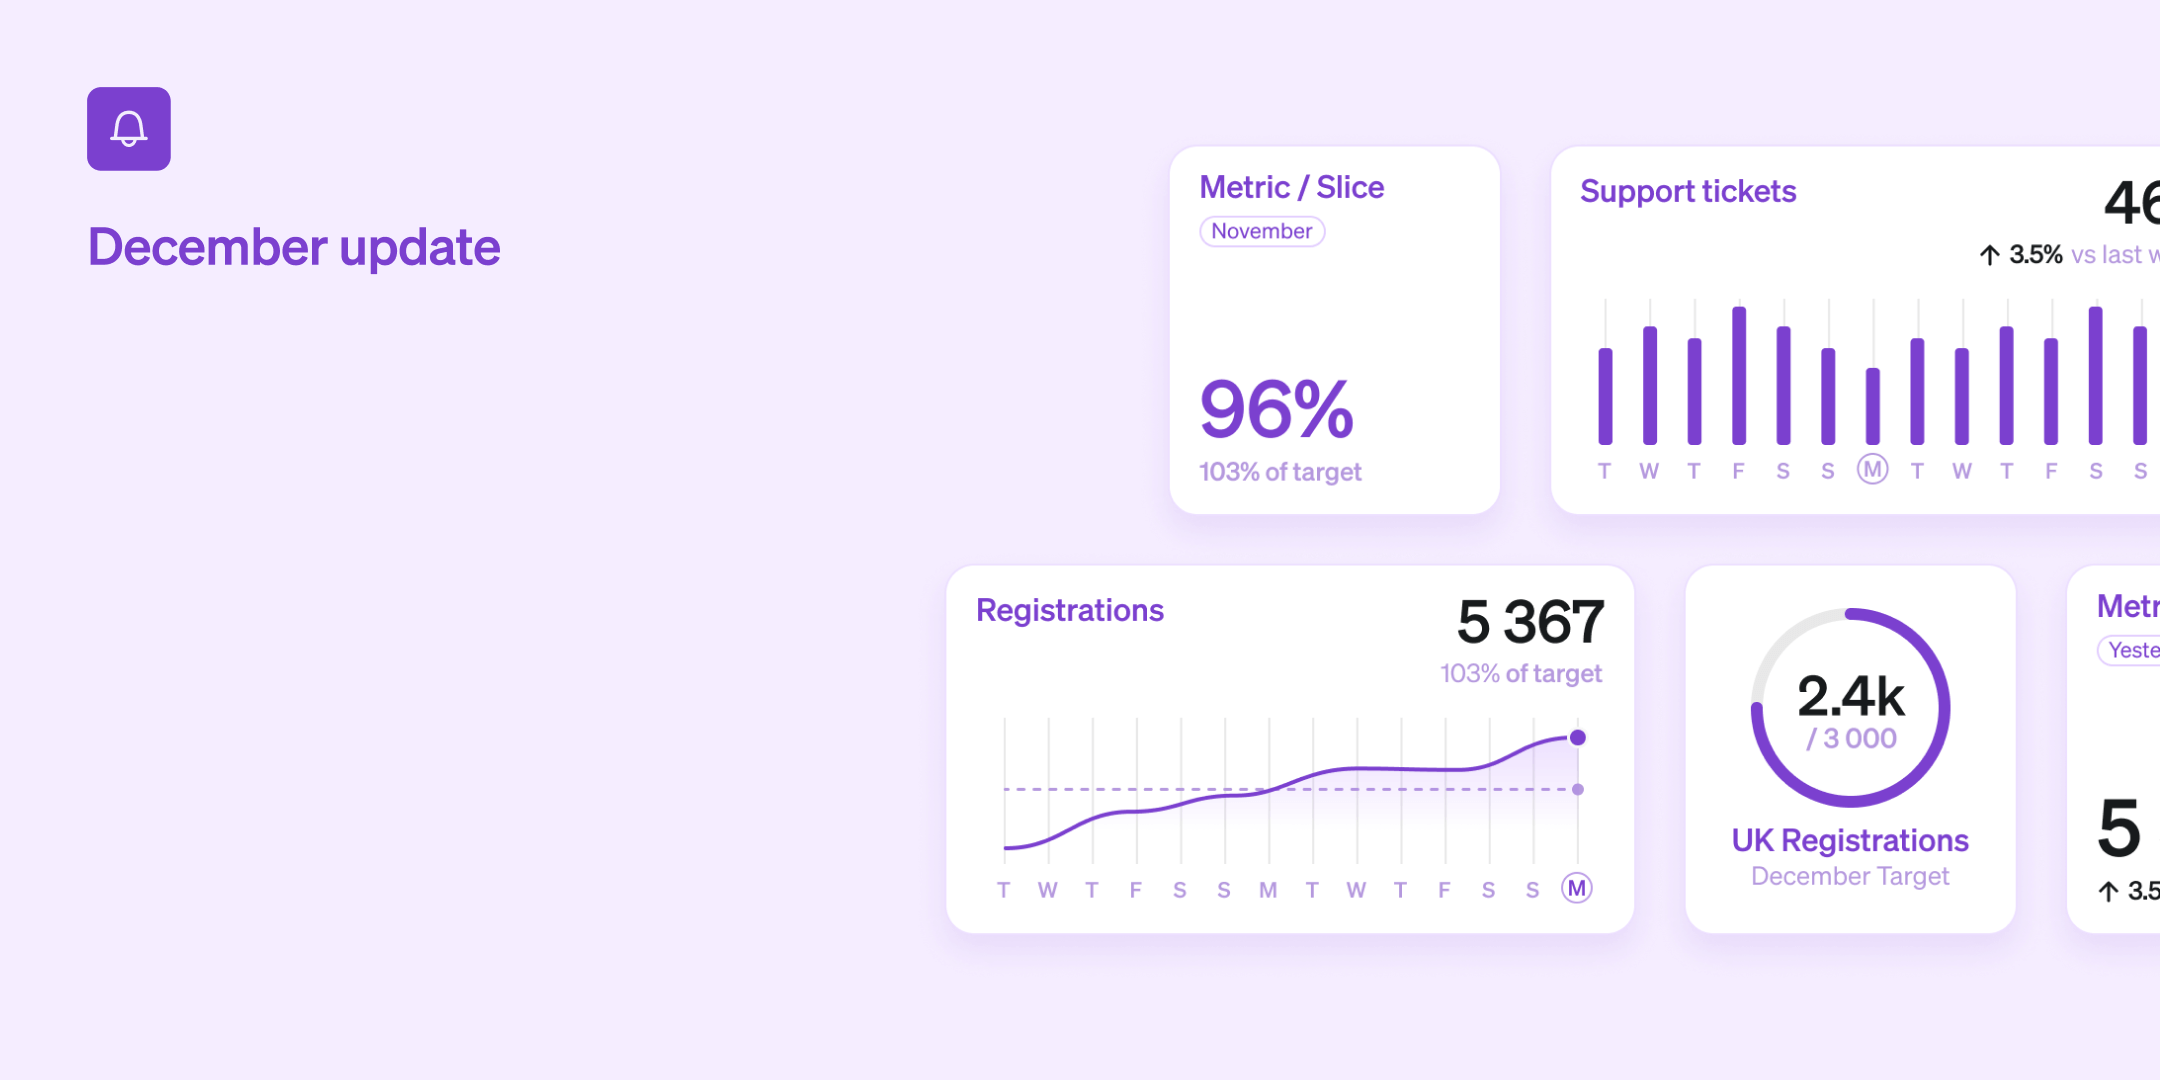
The year is coming to an end and we are wrapping up with a whole bunch of new features and improvements. Our focus has been on enabling even more teams to be able to use Steep as well as new ways of gaining insights from your data. A big thanks to all of you for this year! Let's get to the news.

Express yourself
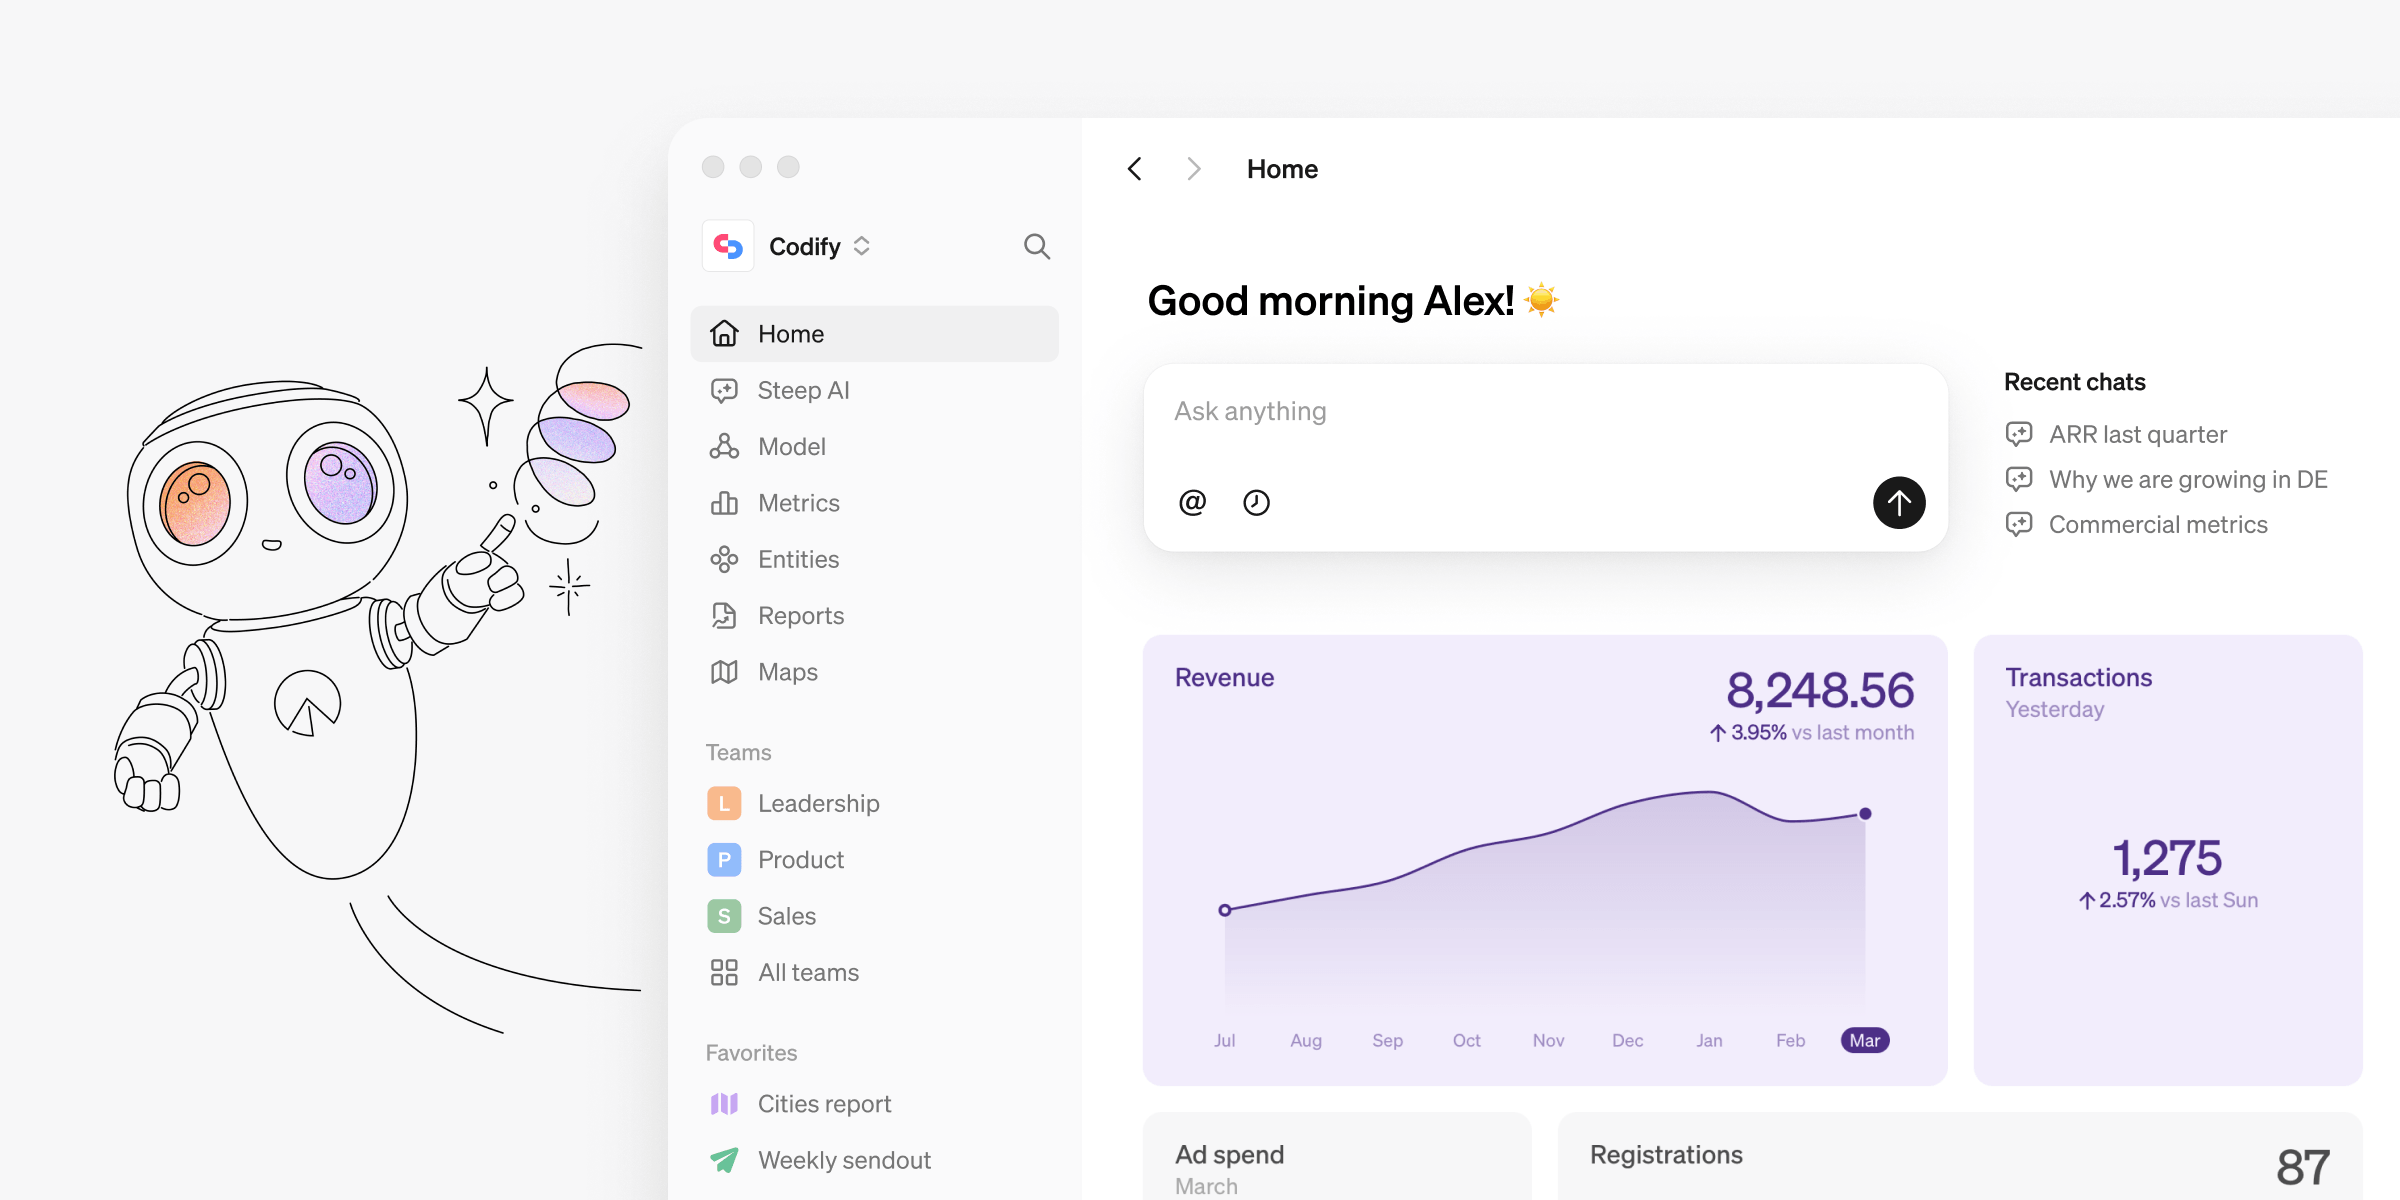
Find just the right widget to represent each metric on your dashboard. This month we have added two new widget types to your toolbox, enabling more customization and a more dynamic dashboard. Any widget with a bar graph now has a Line graph alternative. Just swipe right in the widget settings. Want to focus on the numbers? Use the new Big number widget.
![]()
Rank visualization
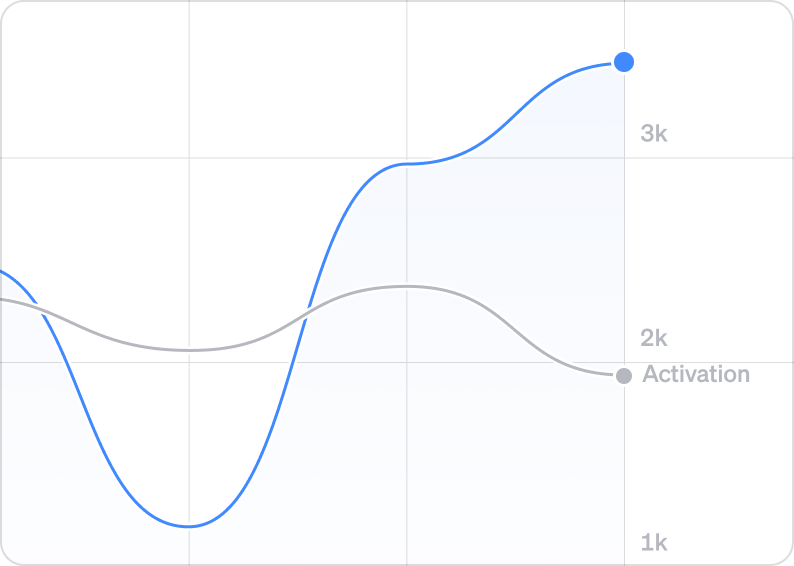
What share of our user base do we cover with our top three markets? How does our top performers compare to our bottom ones? You can now answer these questions and more with our new powerful Rank visualization!
Flip between time series and Rank to visualize a metric with a vertical dimension breakdown. Values and percentages to the right gives you easy insights, and time period selection works beautifully. As intuitive as it is powerful, this much asked-for feature is available now.
Compare metrics
Overlay any two metrics with just a click to easily see correlations and trends. Just expand the Compare to section and select a metric to get started. It works great with both bar graphs and line graphs. Finding patterns across your metrics have never been easier.
Custom templates
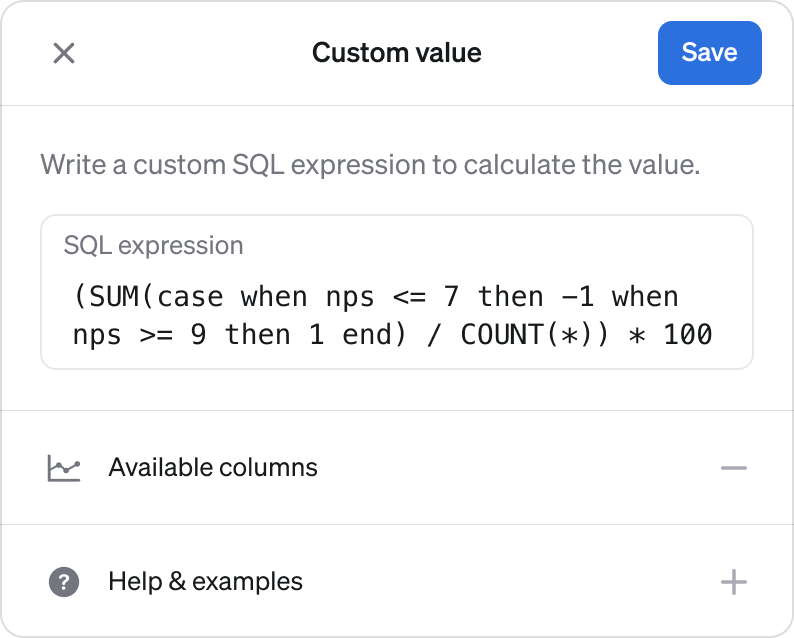
You can now create custom metric definitions with SQL for when the built-in templates are not enough. This lets you add virtually any type of metric to Steep. Create a new metric and chose one of the new templates - Custom value with a single SQL expression - or Custom ratio to divide one value with another. Combined with our live preview feature, this makes setting up tricky metrics a breeze.
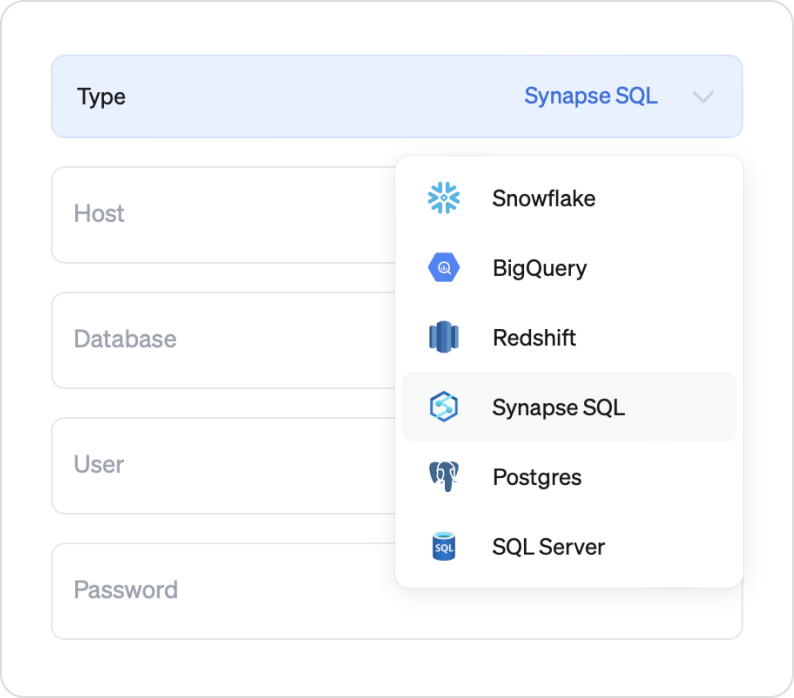
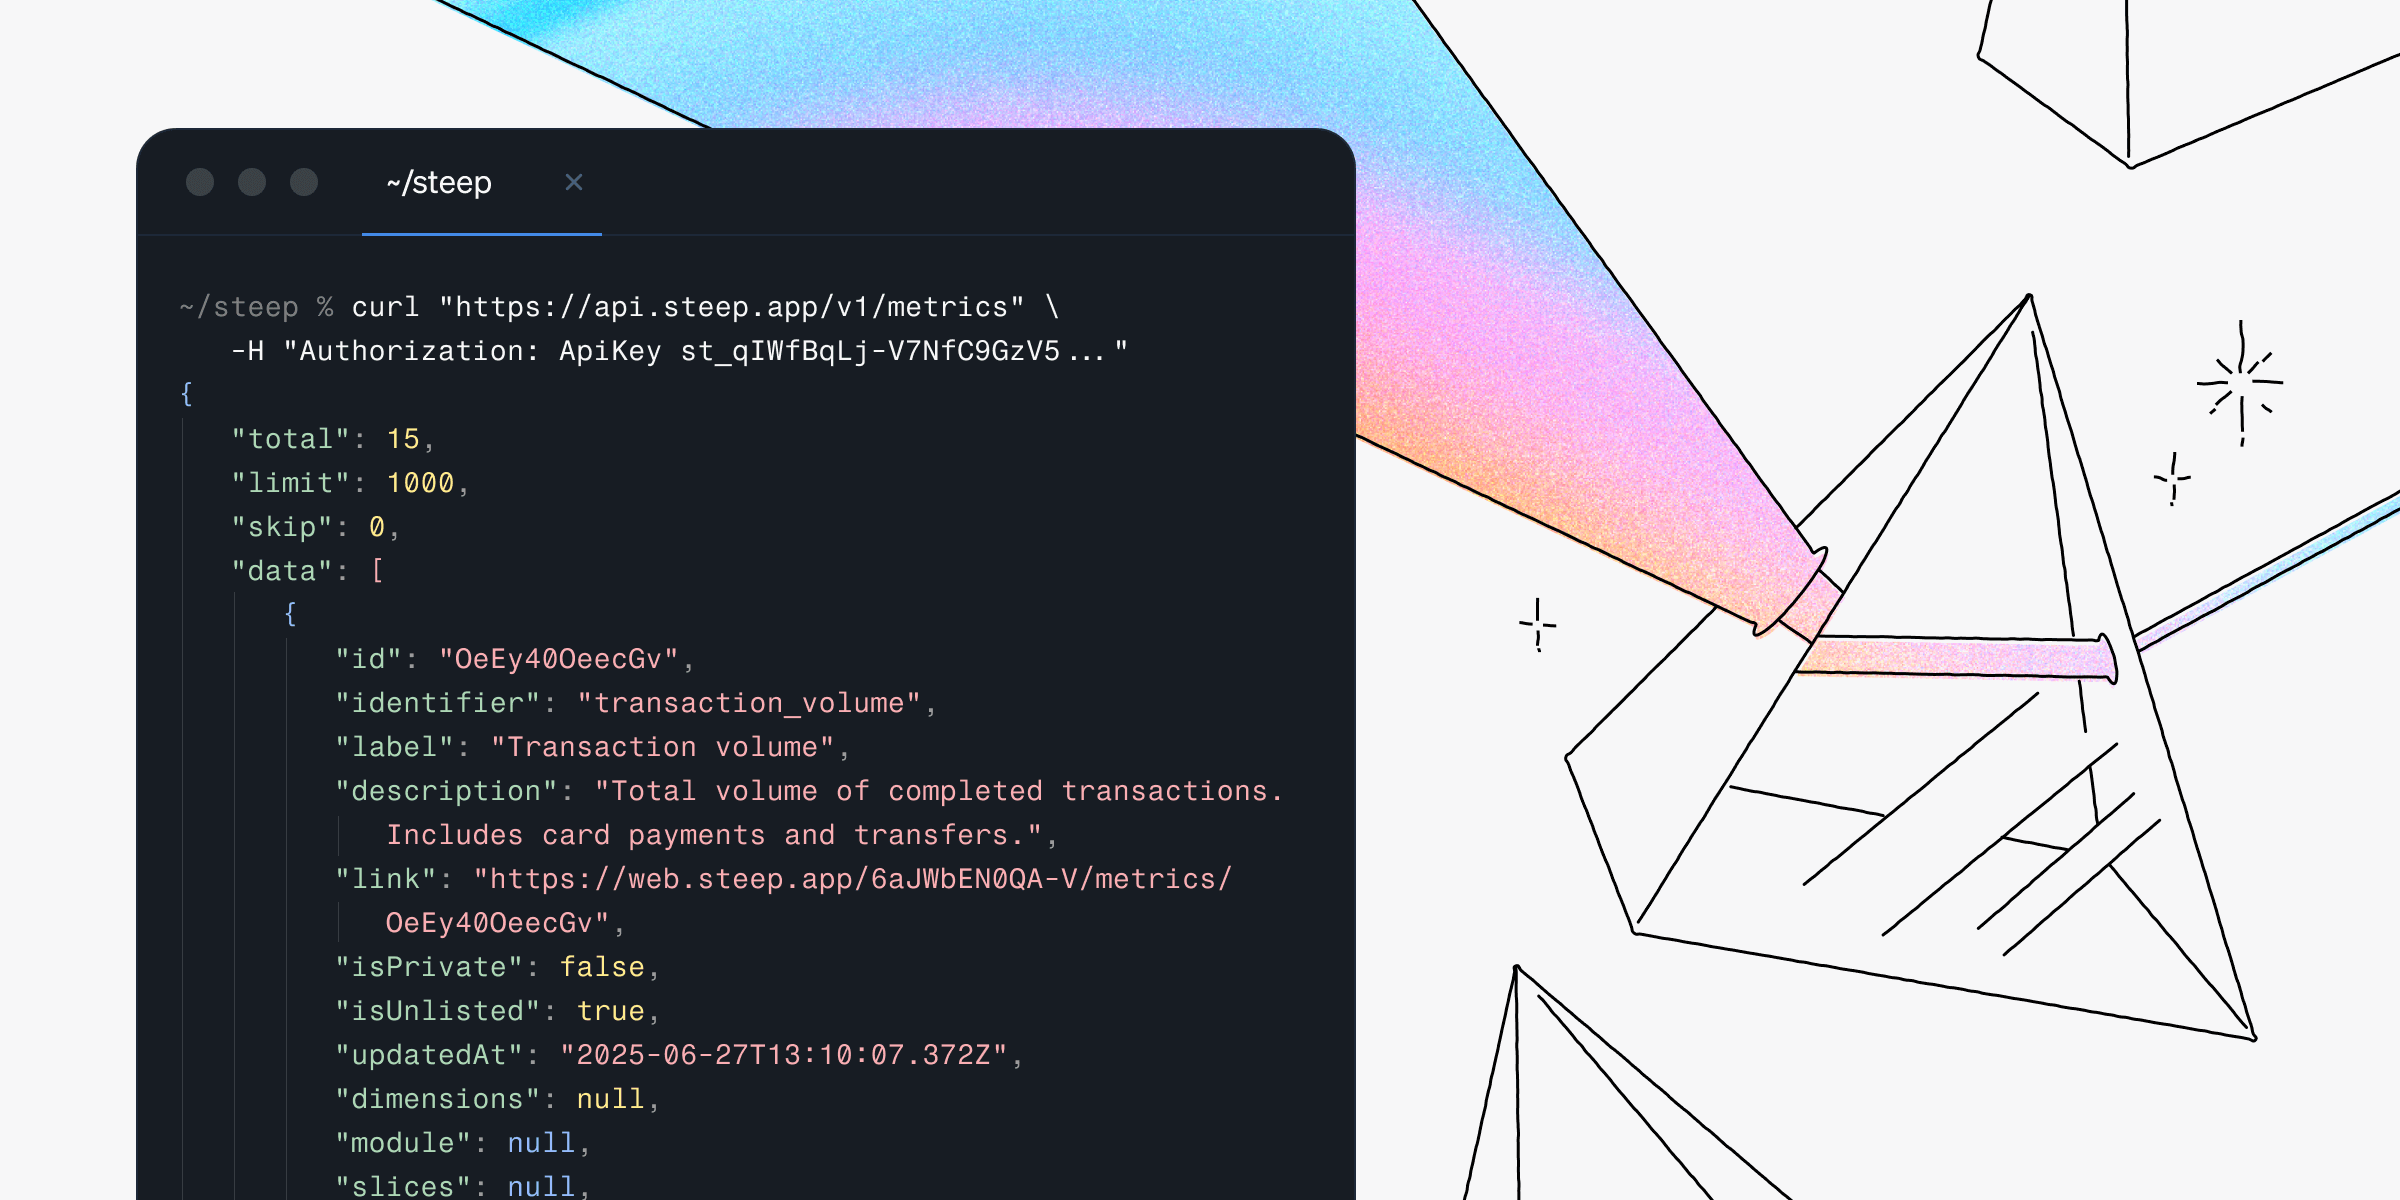
Support for Microsoft SQL Server and Synapse
And finally for all teams running on Microsoft - we have added support for Microsoft SQL Server and Synapse to our list of supported databases. Together with BigQuery, Snowflake, AWS and PostgreSQL, Steep now supports the vast majority of data setups.
What's next?
- We are making it easier to define metrics in code, helping data engineers to manage key metrics with full control.
- We are working on even more ways to visualize your data. Giving you better insights for a wider variety of scenarios.
- Try out and experience the power of Steep faster, without connecting your database.
Book a demo
Get help with exploring the platform and discussing use cases for your team.
Get started
Explore for free. Get your own workspace or try the demo setup.
More posts

Intro to Steep
By Janna Pollari·Events

Webinar with Daana
By Janna Pollari·Events

Meet us at Snowflake Summit 2026
By Deanne Anderson·Events
Introducing Steep AI
By Nino Höglund·Product

A builder's guide to the Steep API
By Hanna Kjellén·Inside Steep
New in Steep: API – Metrics power anything
By Nino Höglund·Product