Our most recent updates improve comparing and exploring your data and gives the data team new tools for advanced configuration and governance.

Customize and explore
We’ve added more customization options and everyday functionalities to make analysis in Steep smoother and more flexible for all users.
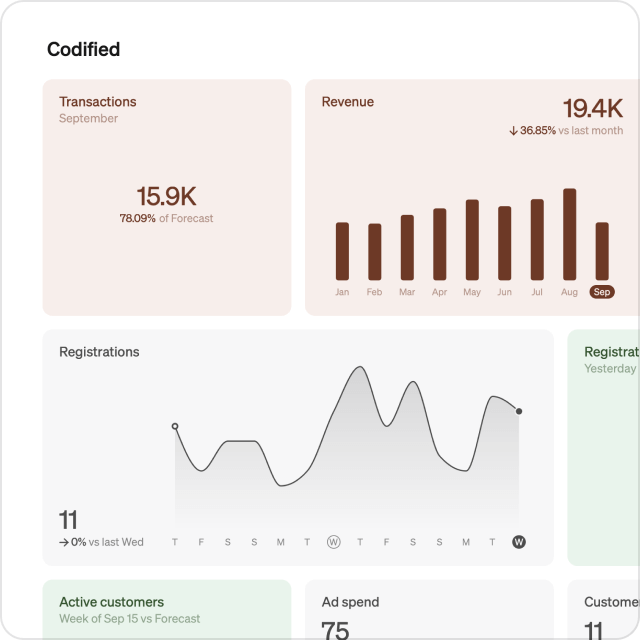
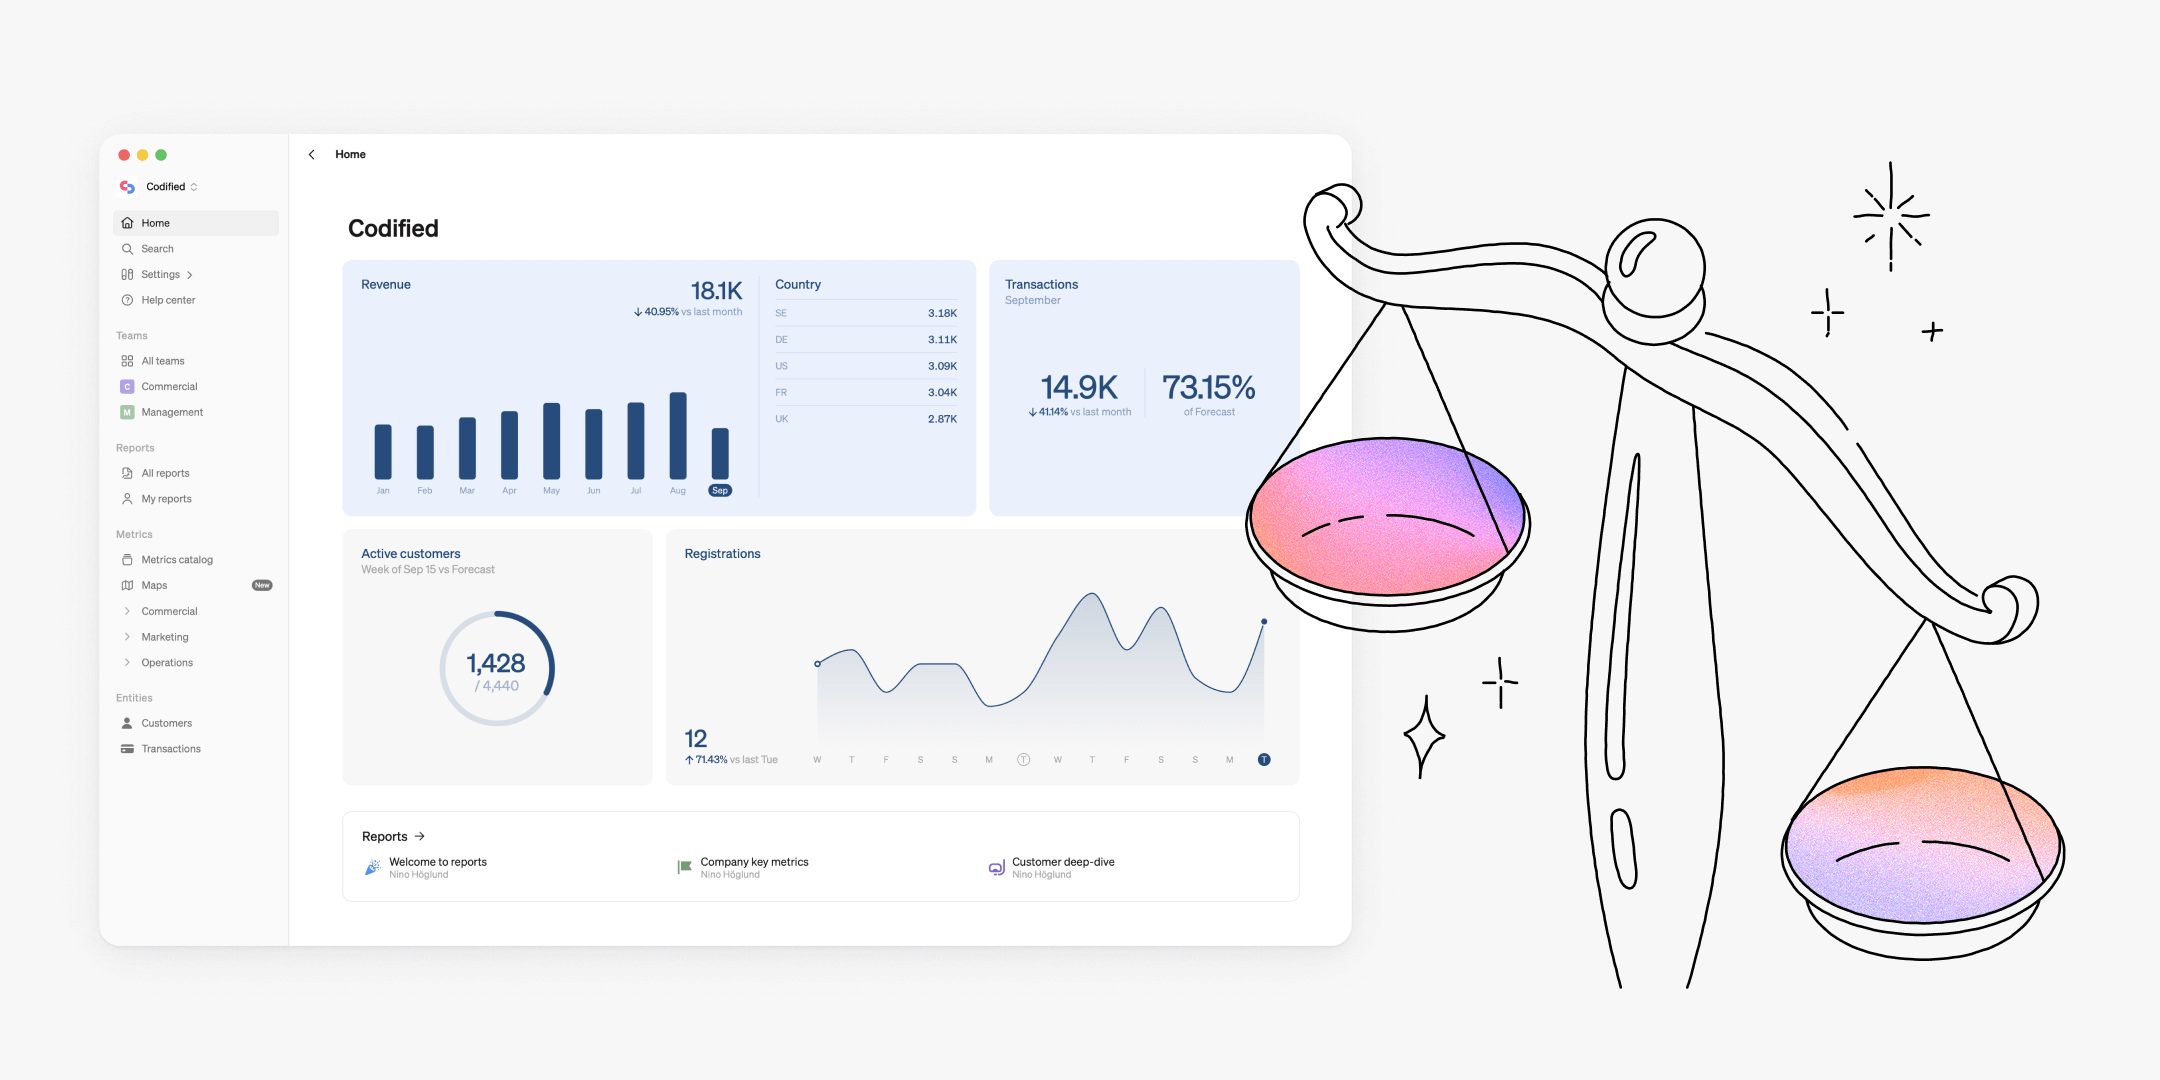
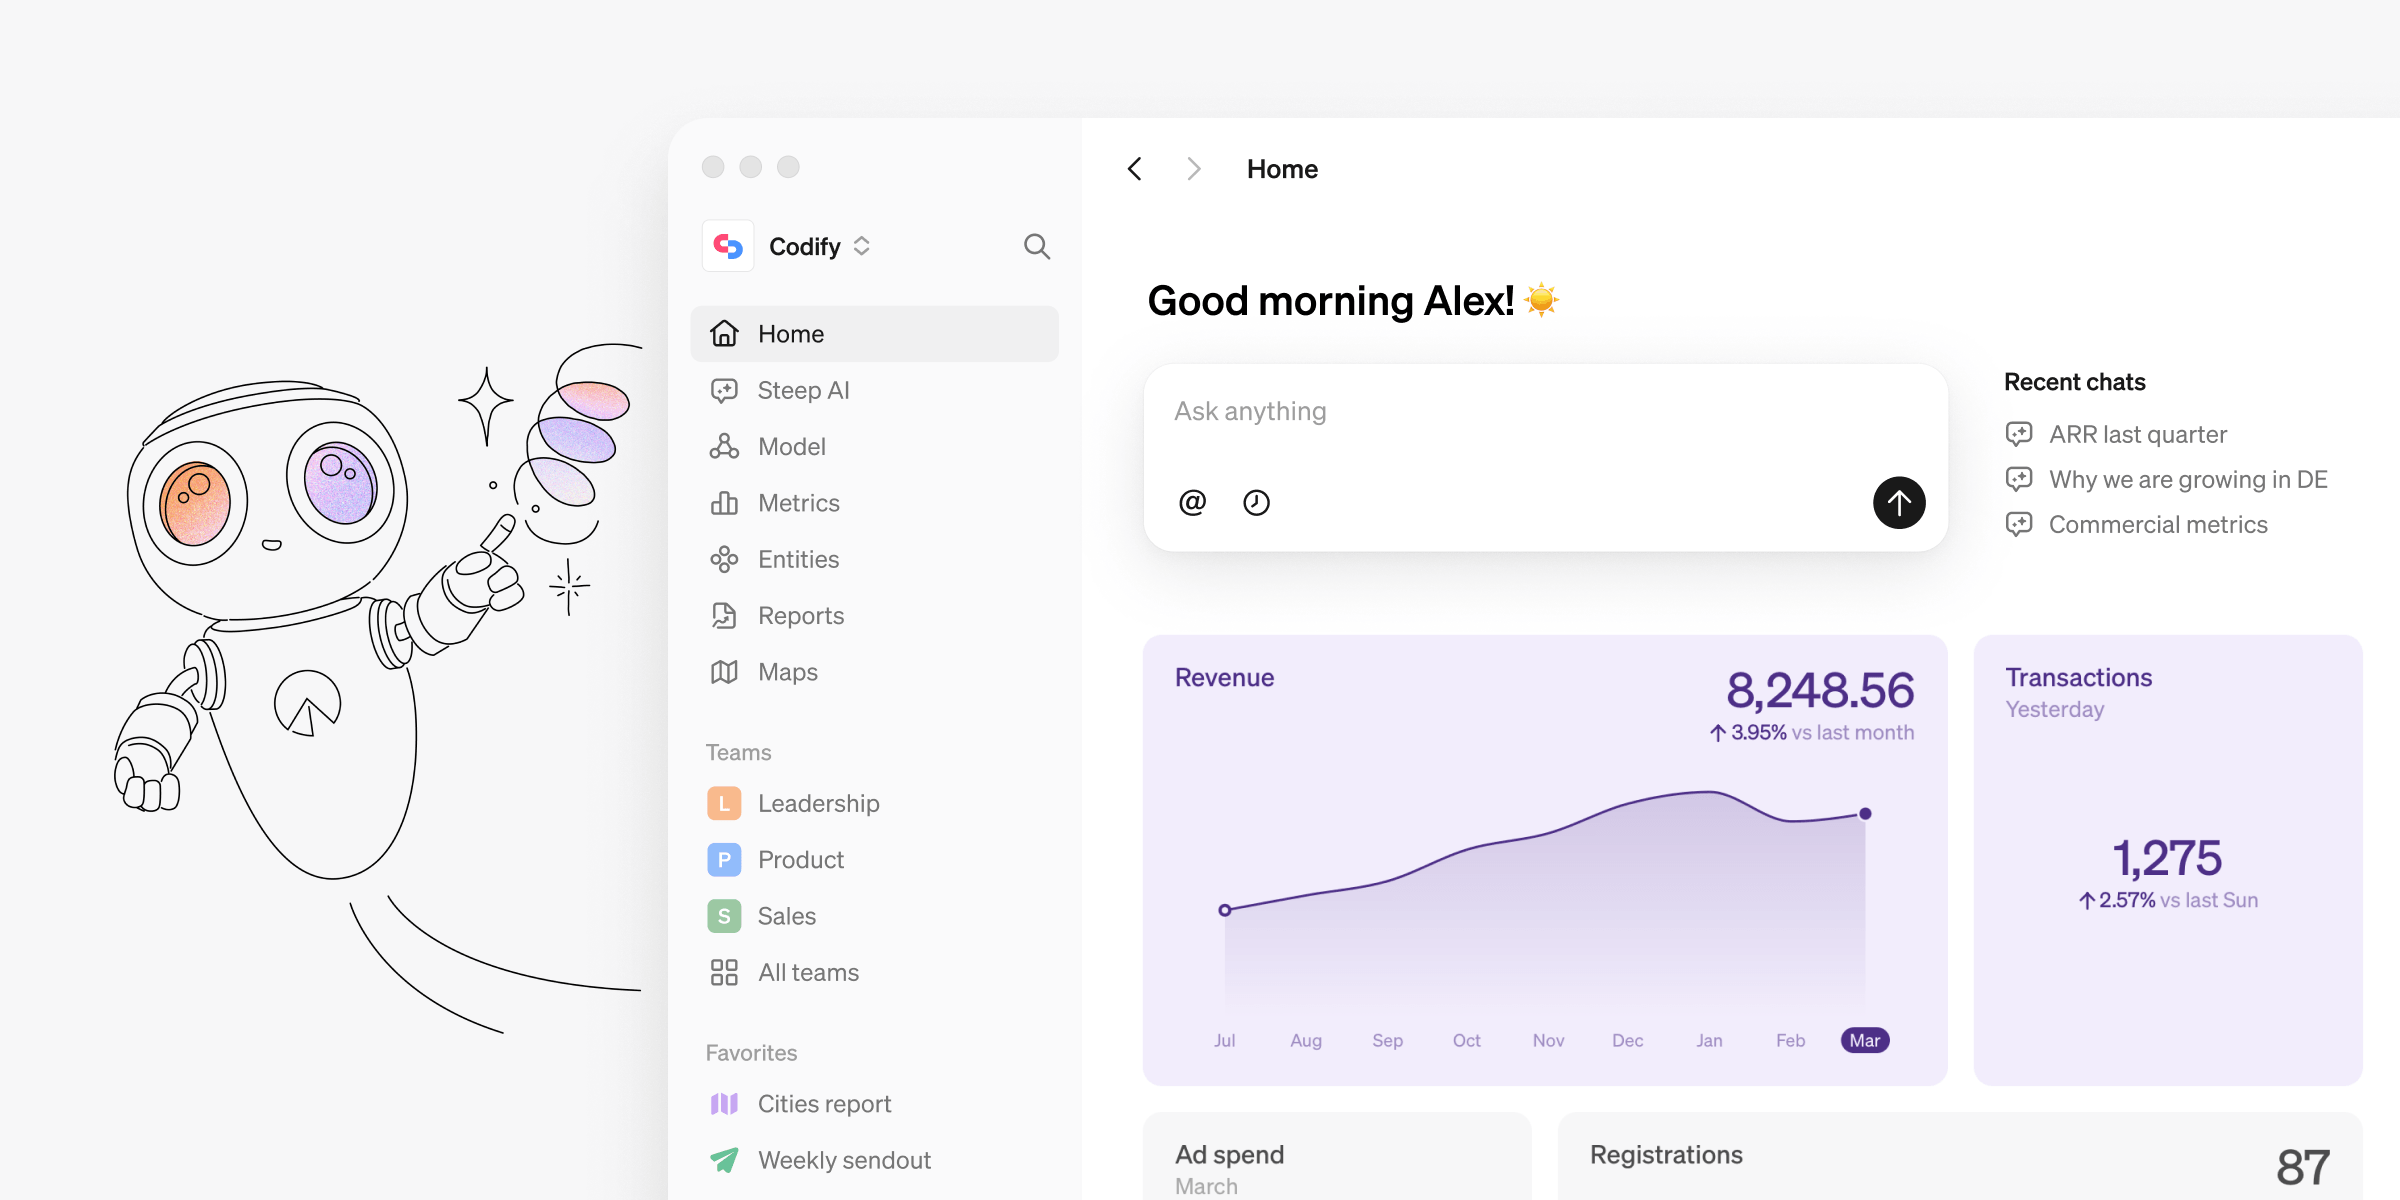
Updated home and team screen design
We’ve given the home screen a new, sleek look that adapts seamlessly to any device you’re using. The improved layout utilizes the full width of your screen, so your most important metrics are easy to keep track of when logging in to Steep.
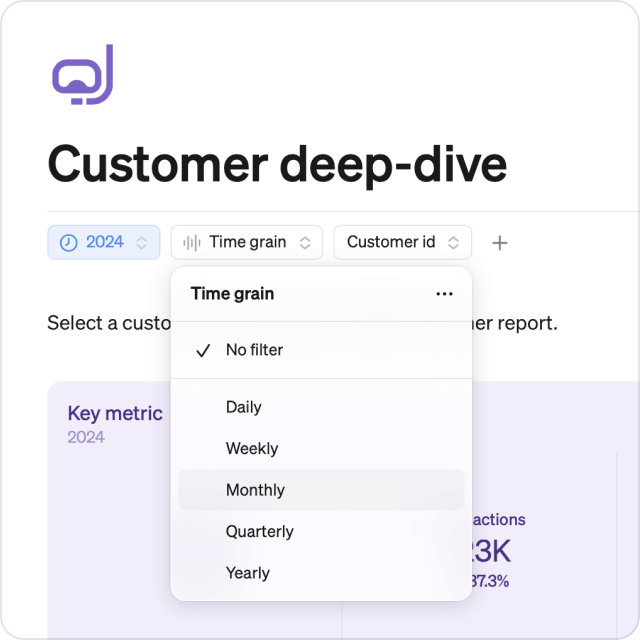
Filter reports by time grain
You can now filter your reports by any selected time grain, ensuring all chart blocks in the report match in a consistent view.
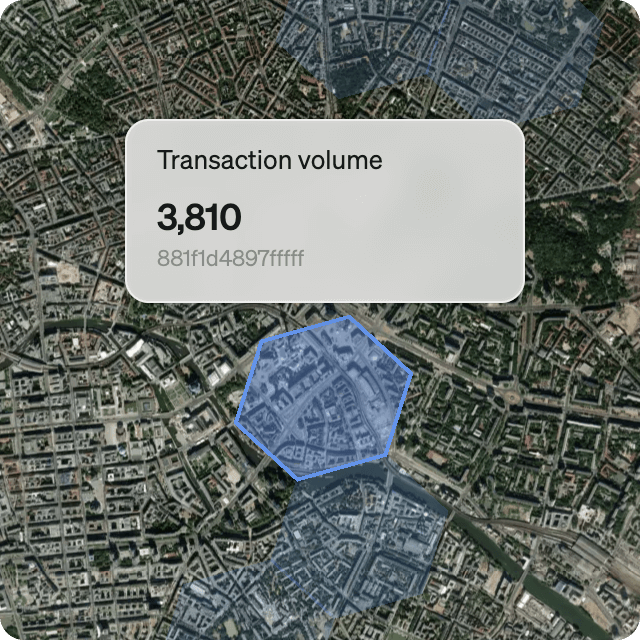
Maps in satellite view
Switch your maps to satellite view for a more realistic view of location and terrain, or keep the default view for a simple layout.
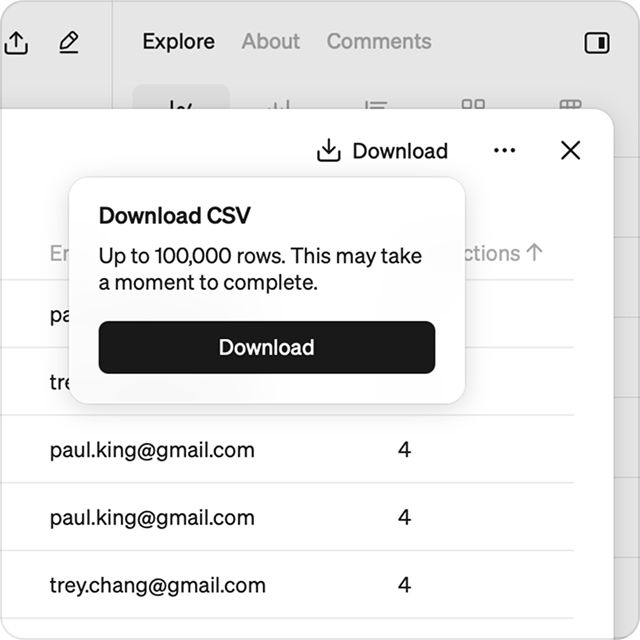
Export from entity drill-downs
You can now export lists directly from a metric drill-down. This makes it easy to download a list of relevant data you’re viewing
Easy comparisons
We’ve made fresh updates to give you more control and clarity with comparisons. These updates make comparing metrics and time periods, across any time grain – more intuitive.
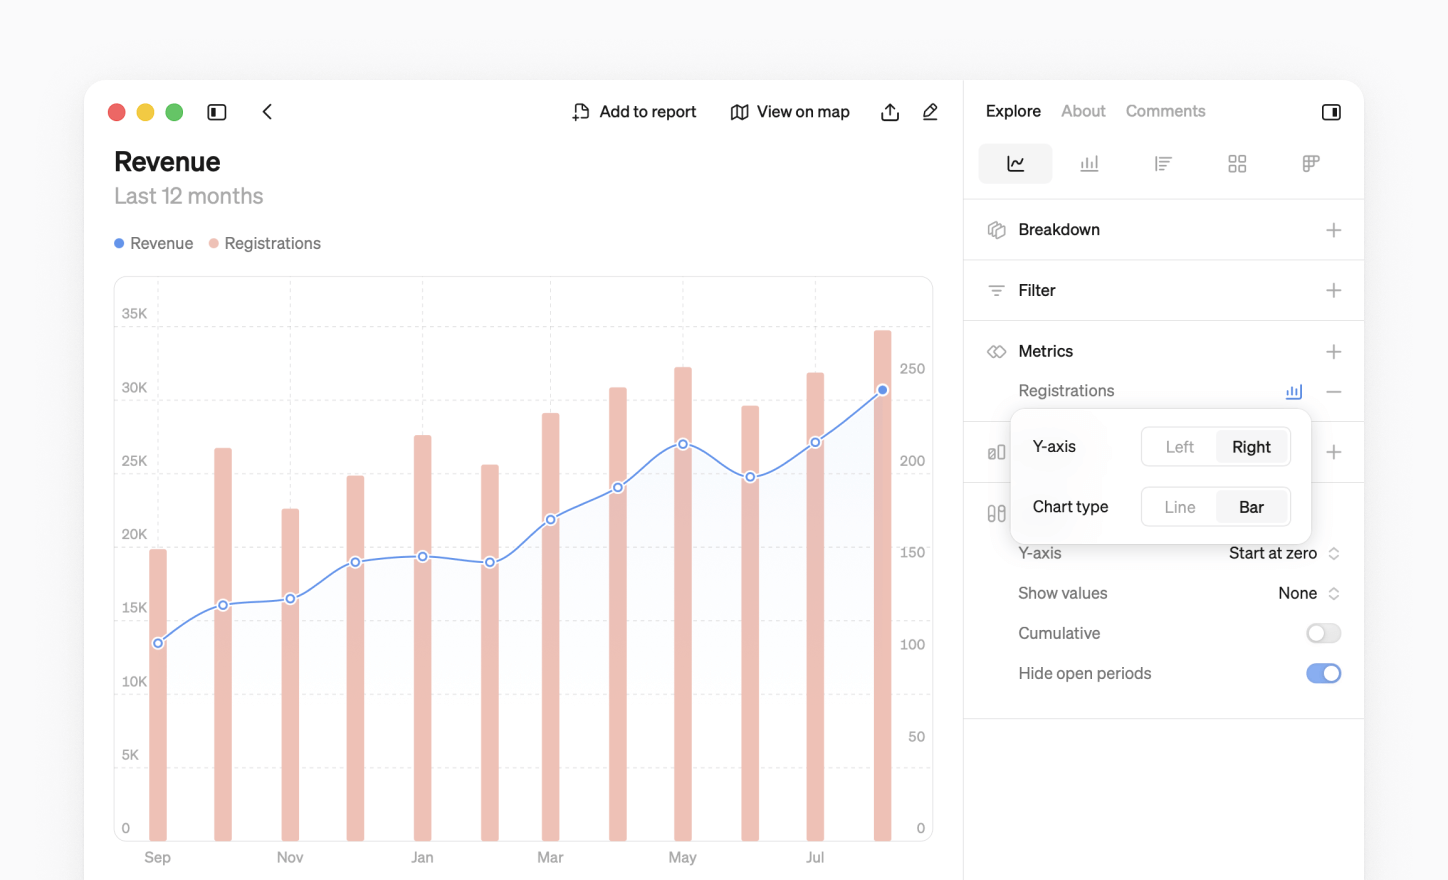
Combine line and bar charts
Customize how each metric is visualized in your comparisons. Combine bar and line charts freely within the same visualization for clearer insights.
Choose y-axis
Choose how the y-axis is displayed – left or right – in your comparisons to improve the readability of your chart. This improves visualizing metrics with different ranges without losing detail.
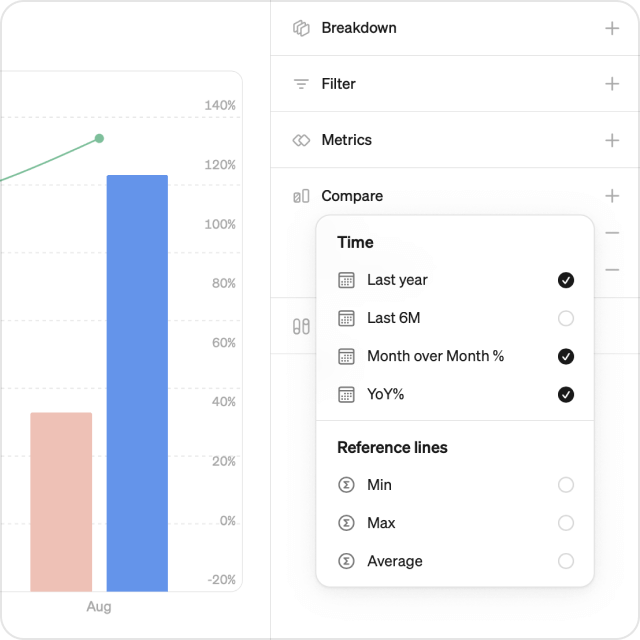
Year over year on all time grains
Now you can view YoY% comparisons on any chosen time grain. Previously limited to the yearly time grain, you can now easily track growth and seasonality at any level.
Bar charts read left to right
We’ve tidied up how bar chart comparisons are displayed. Now the main period appears on the right, and the comparison on the left, so that timelines always flow logically.
Setup and governance
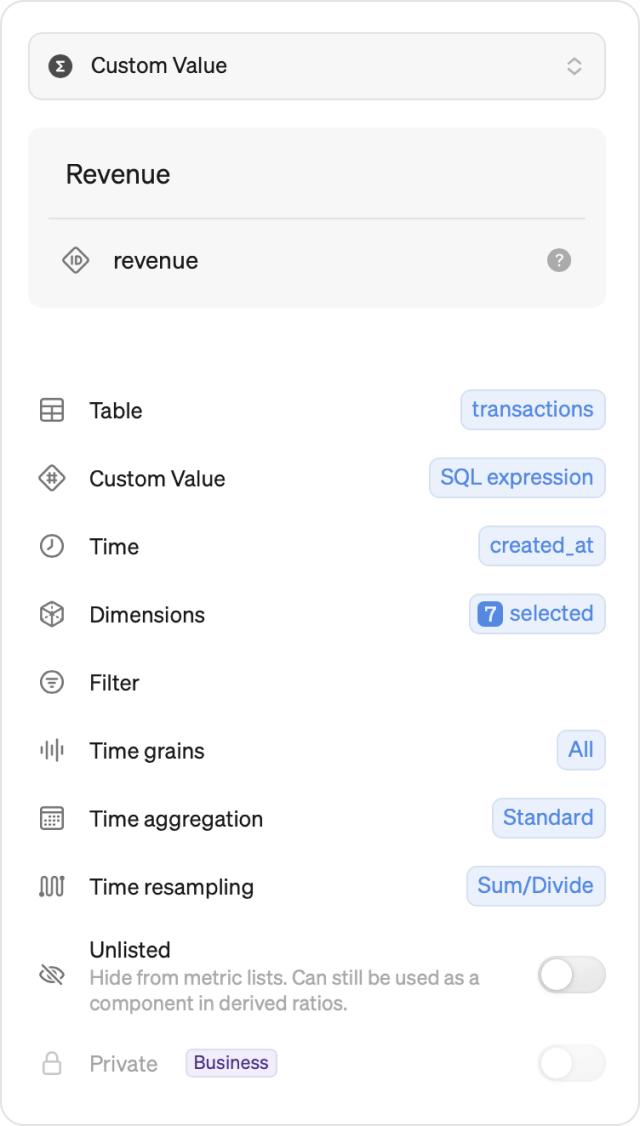
Unlisted metrics
You can now unlist a metric, allowing it to be used in derived ratio metrics, while hiding it from the metric catalog for non-admin users. This is useful for support metrics that may not be meaningful on their own but valuable in derived metrics.
Numerator-only dimensions
You can now add dimensions that apply only to the numerator of a derived ratio metric, giving you more options to apply breakdowns and filters to those metrics.
Custom time resampling for targets
Steep automatically resamples targets to any chosen time grain, regardless of the definition in the original data table. You can now choose to set the time resampling for any metric type to Sum/Divide or Average/Repeat.
Cache settings and more
Steep uses smart caching to speed up usage and prevent duplicate queries and warehouse load. Cached results are stored for a set time, so repeat queries return instantly without reloading fresh data.
Admins can now set a cache duration for all metrics and entities to 1, 2, 4, or 8 hours under Settings>Workspace. Available in the Business and Enterprise plans.
In addition to this month’s updates, we’ve optimized performance to ensure a faster and more seamless user experience in Steep.
Book a demo
Get help with exploring the platform and discussing use cases for your team.
Get started
Explore for free. Get your own workspace or try the demo setup.
More posts

Intro to Steep
By Janna Pollari·Events

Webinar with Daana
By Janna Pollari·Events

Meet us at Snowflake Summit 2026
By Deanne Anderson·Events
Introducing Steep AI
By Nino Höglund·Product

A builder's guide to the Steep API
By Hanna Kjellén·Inside Steep
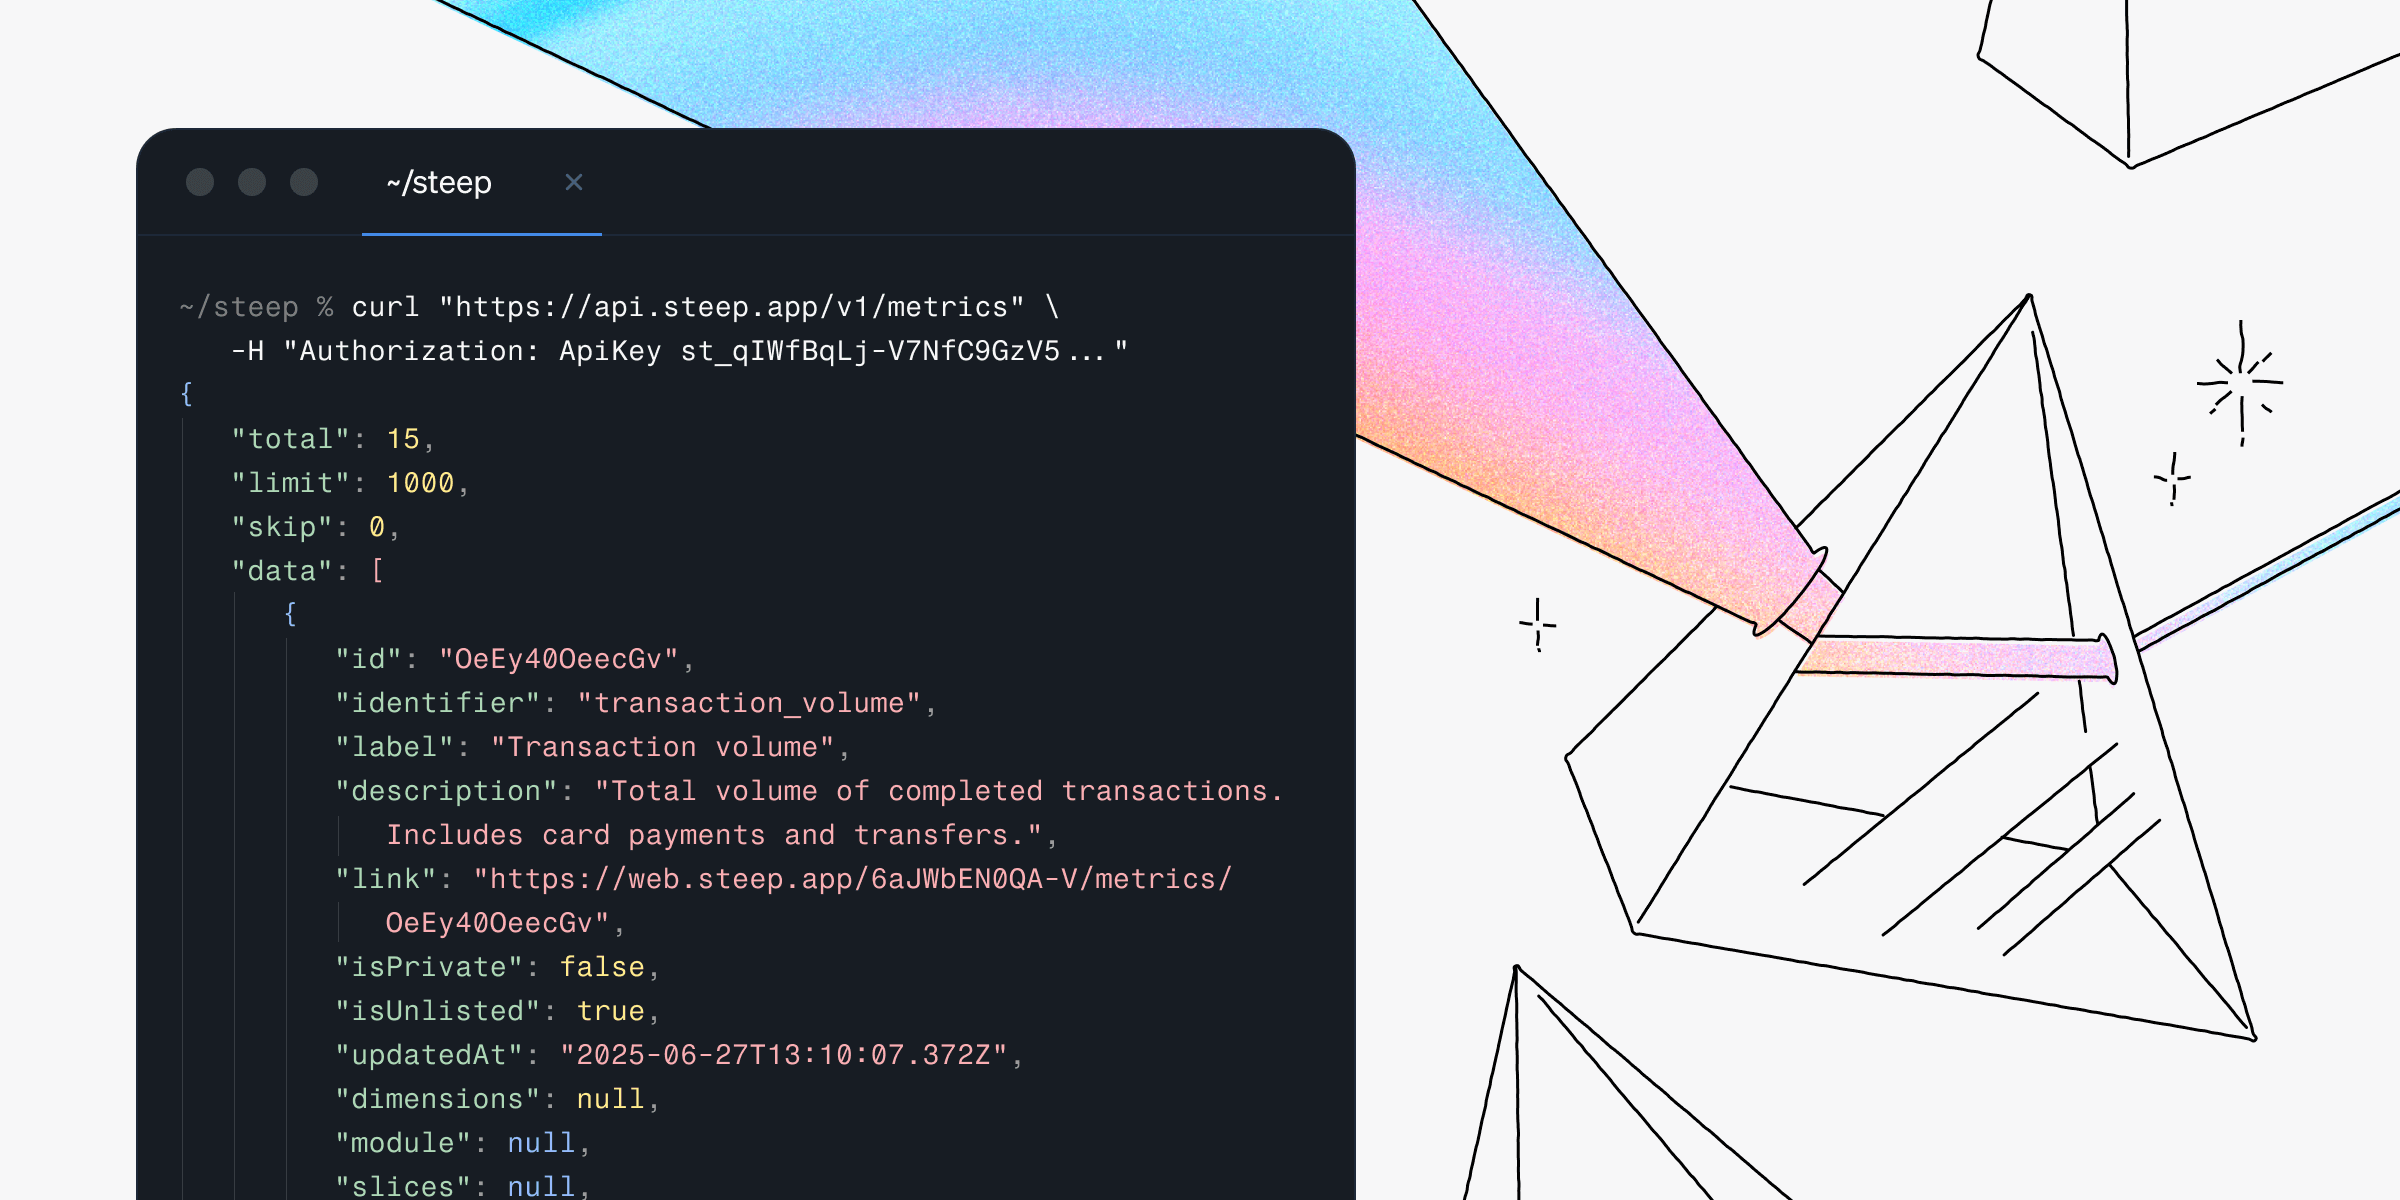
New in Steep: API – Metrics power anything
By Nino Höglund·Product