Governed metrics are how companies stop arguing about whose number is right. This guide explains what they are, shows what one looks like in practice, and shares what data teams have learned about making governance work without losing self-service.

Ask your Head of Growth, your CFO and your Head of Product how many monthly active users you have. If you get three different numbers, you might have a metric governance problem.
Governed metrics are business metrics that are defined once in a central place, owned by a named person or team, and used consistently by every report, tool and AI system in a company. Anyone can explore them. Changes to the definition are agreed with the metric’s owner.
None of the three numbers is wrong. Each person is answering a slightly different question. One counted anyone who logged in. Another counted anyone who completed an action. A third pulled the figure from a product analytics tool with its own logic built in. Each metric was defined separately, in a different place, by a different person, for a different purpose.
That’s what ungoverned metrics look like, and it’s far more common than it should be. Governed metrics fix it, not by locking data down, but by agreeing on a definition once and making it available to everyone.
What makes a metric governed?
A governed metric has five properties:
- Intentional. Nobody creates a governed metric by accident. Defining one takes deliberate decisions: which data it comes from, how it’s calculated, which filters apply, and which dimensions it can be broken down by.
- Central. It lives in one place, usually a metrics catalog or semantic layer. It doesn’t live inside a single report, a spreadsheet, or a BI tool only one team can open.
- Owned. A named person or team is accountable for the definition. They answer questions about it, keep it accurate and approve changes.
- Consistent. Every report, tool and AI query that uses the metric draws on the same definition, so the same question gets the same answer.
- Change-controlled. Changes are reviewed, versioned and communicated. Everyone can explore and analyze the metric freely. Changing what it means goes through the owner.
An example: governing “monthly active users”
Back to the three MAU numbers. Here’s what each team was counting:
| Team | What they counted | Where it lived |
|---|---|---|
| Growth | Any user who logged in during the month | A dashboard in the BI tool |
| Finance | Paying users who logged in during the month | A spreadsheet |
| Product | Users who completed a tracked event | The product analytics tool |
And here’s what the governed version looks like once the teams agree on one definition:
| Field | Governed definition |
|---|---|
| Metric | Monthly active users (MAU) |
| Definition | Distinct users who completed at least one core action (such as creating a project or sending a message) in a calendar month |
| Source | Product events table in the data warehouse |
| Filters | Excludes internal, test and deleted accounts |
| Dimensions | Plan, region, signup cohort, acquisition channel |
| Owner | Head of Product Analytics |
| Version | v2: changed from “any login” to “core action,” reviewed and approved by the owner |
| Status | Published to the metrics catalog |
Growth, Finance and Product still see MAU broken down the way they need it, by plan, region or channel. What they no longer do is count it three different ways.
Two teams need different numbers? Govern both.
Sometimes a disagreement is legitimate. Two business lines may need to measure revenue differently. The fix isn’t to force one number. It’s to make the difference explicit with two clearly named, separately owned metrics, such as “Net revenue (e-commerce)” and “Net revenue (wholesale).”
Governed vs. ungoverned metrics
| Ungoverned | Governed | |
|---|---|---|
| Where it lives | Scattered across reports, spreadsheets and tools | A central metrics catalog or semantic layer |
| Who defines it | Whoever builds the report | The metric owner, deliberately |
| How it changes | Silently, by anyone with tool access | Through review, with version history |
| Consistency | Varies by team and tool | Consistent everywhere it’s used |
| AI analytics | Answers can vary with how the AI reads the raw tables | Grounded in one agreed definition |
What ungoverned metrics cost you
Ungoverned metrics cost more than the time spent arguing about them:
- Slower decisions. Leaders hold off on acting when they can’t tell which number is right.
- Lost analyst time. Data teams spend hours investigating discrepancies that shouldn’t exist.
- Eroding trust. Each time someone gets burned by an inconsistent number, they trust the data a little less and fall back on gut instinct a little more.
- Unreliable AI. AI tools are only as consistent as the definitions they work from. Give an assistant raw tables and no agreed definition, and its answers can change with how it reads the data.
How metrics become ungoverned in the first place
Nobody sets out to create ungoverned metrics. It usually happens in one of three ways:
- Tool sprawl. Every new tool is another chance for a metric to be redefined. Each one gets set up by a different team, for a different purpose.
- Team autonomy without coordination. Teams build their own reports to move fast. Nobody means to create inconsistency, but it happens anyway.
- No ownership. When nobody is responsible for a definition, it drifts. Someone tweaks a filter, someone else changes a date range, and nobody tells anyone.
Governed metrics vs. semantic layer vs. metric governance
These terms get used interchangeably, but they mean different things:
- Metric governance is the practice: the ownership, review and lifecycle rules a company uses to manage its metrics.
- A governed metric is the result: an individual metric that has been through that process.
- A semantic layer (or metrics layer) is where governed definitions live technically. It translates a metric like “MAU” into the right query against your data, so every tool gets the same answer. Examples include the dbt Semantic Layer, Cube and Steep’s own semantic model.
- Governance metrics are something else entirely: the KPIs a company uses to measure its data governance program, such as data quality scores.
You don’t have to choose between a semantic layer and a tool like Steep. If your team already defines metrics in the dbt Semantic Layer or Cube, Steep can use those definitions, so there’s still one definition behind every number.
How to govern a metric
The steps are the same whatever tools you use:
- Agree on the definition. Get the people who use the metric together and settle what it means.
- Connect to the source. Choose the warehouse table or model the metric is built from.
- Define the calculation and filters. Specify exactly what’s counted, and what isn’t.
- Define the dimensions. Decide how people can break it down: region, product, channel, customer segment.
- Assign an owner and set access. Name who is accountable, and decide who can see the metric and at what level of detail.
- Publish it centrally, with version history. Put it in the catalog where everyone can find it, and record every change.
Step 1 is where most of the effort goes. Ask a data engineer who has been through it, and you’ll hear that the hardest part isn’t the tooling. It’s sitting down with every team, each with its own version of the metric, and agreeing on one. That’s a culture and communication challenge, rather than a technology one.
How this works in Steep
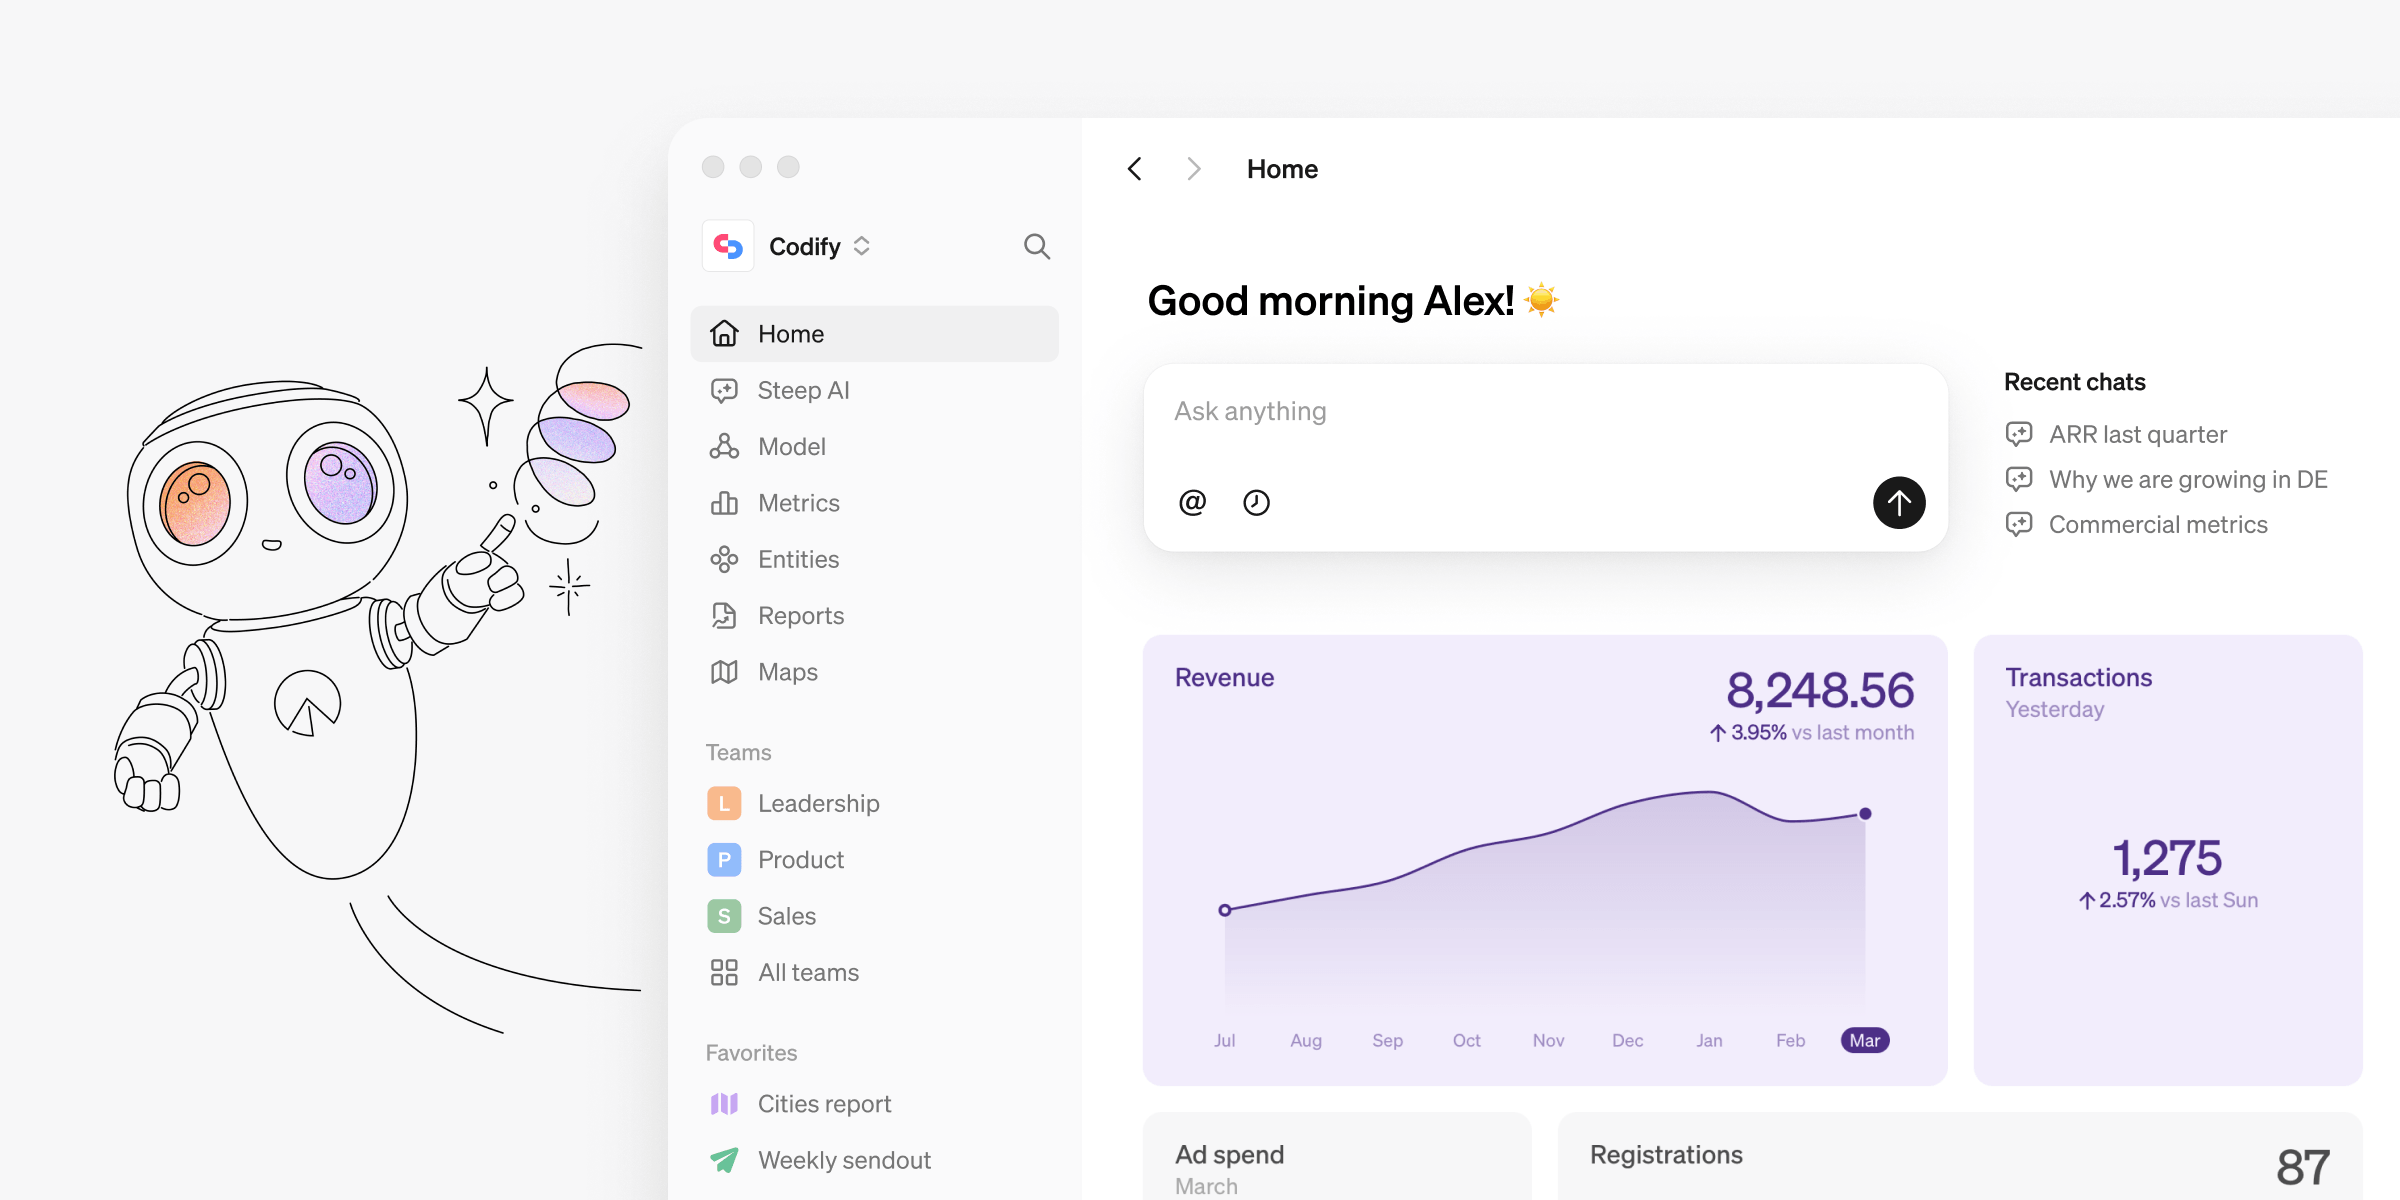
Every metric in Steep lives in the metrics catalog, with a named owner. Data teams define metrics in the in-app editor, or in code with pull-request review and a full change history. Access can be set down to individual metrics and rows. Admins can edit any metric, and the named owner shows everyone who is accountable for it. How closely owners review changes is up to your team.
What data leaders told us about governing metrics
We’ve talked with many data and business teams about how they manage metrics. These are some of the most practical lessons we’ve heard.
1. Spread ownership across domains instead of centralizing it
Rather than the data team owning every definition, split metrics into domains (marketing, in-app purchases, payments, user journey, core company KPIs) and give each an owner in the business. A data lead who rolled this out described the payoff: governance stops bottlenecking on the data team, and the people closest to each metric are accountable for it.
2. Make the owner easy to find
Ownership only works if people can see it. Where owners are visible, a useful habit forms: when a metric’s trend changes, people look up who owns it and ask that person directly.
3. Give each metric a business owner and a technical owner
An analytics engineer at a fast-growing company described the setup that finally made governance stick for their team: a business owner and a technical owner for every metric, automated alerts that notify the owner, and checks before any change to a definition is merged.
4. Test a new definition alongside the old one before switching
Rather than changing a definition overnight, a data lead at a services business ran new versions of a core operational metric next to the original and tracked which one people actually used. Versioning makes this possible without a big-bang switchover.
5. Give AI more than a description
Teams building AI on top of their metrics keep running into the same lesson. A short description doesn’t give an AI enough to go on, and neither does a markdown doc: it’s just text, with no guarantee an agent will use it. Add synonyms, business interpretation and guidance on when (and when not) to use the metric, and keep the definition in a semantic layer so it’s applied to the query itself.
Where to start
You don’t need to govern every metric on day one. Start where disagreement is loudest:
- Pick 5–10 metrics leadership reviews every week. Revenue or MRR, active users, churn, pipeline and customer acquisition cost are common starting points.
- Find the duplicates. List every version of each metric that exists today, and where it lives.
- Agree, assign and publish. Settle one definition (or two clearly named ones), assign an owner and publish it centrally.
- Retire the rest. Point old reports to the governed metric, or archive them.
- Expand domain by domain. Once leadership metrics are stable, hand ownership to the teams closest to each domain (see tip 1 above). Cabonline is taking this approach to build one governed set of metrics across its ten brands, starting with Operations and expanding department by department.
Not every metric needs the same governance
Instabee Group, the company behind Budbee, Instabox and Porterbuddy, sorts its metrics into layers, like an onion. Strategic metrics at the core get full governance. The further out you go, the more teams define their own metrics on top of the same trusted data.
See how Instabee Group decides which metrics to govern centrally →
Why governed metrics matter now
Self-service analytics
Self-service only works if people can trust the metrics they’re exploring. Governed metrics are what make self-service safe: business users get freedom to explore without each having to rebuild the definitions themselves.
At GeoGuessr, the data team owns the definitions, and people in product, growth and finance drill down on their own without filing a ticket. Juni reports 70% fewer data requests since going metrics-first.
AI-driven analytics
AI analytics tools generate answers from the definitions they’re given. Without governed metrics, an assistant may calculate the same KPI in different ways depending on how it interprets the underlying tables. Governed metrics give it one agreed definition to work from, and tip 5 above covers the context that helps it use that definition well. Through the Steep API and MCP server, the same governed metrics are available to LLMs, agents and custom AI applications.
Wunderflats saw the problem firsthand. With Claude connected straight to BigQuery and no semantic layer in between, the same question could get different answers. The team has since rolled out Steep as a governed layer between the two, and in their own benchmark, the same questions used 80–90% fewer tokens.
Governed metrics in Steep
In Steep, governed metrics live in the semantic model: one set of definitions behind every number. Steep is free for up to 3 users, so you can connect your warehouse and start governing your metrics today.
FAQs
What is the difference between a governed metric and a KPI?
A KPI is a metric you use to track performance against a goal. A governed metric is a metric that has been centrally defined, owned and controlled. Your KPIs should always be governed metrics, but not every governed metric is a KPI.
What is the difference between governed metrics and a semantic layer?
A semantic layer is the technology where metric definitions live and get turned into queries. Governed metrics are the definitions themselves, plus the ownership and change process around them.
Do governed metrics slow teams down?
Not when they’re set up well. What’s controlled is the definition, not the analysis, and teams usually spend less time reconciling numbers. Not every metric needs the same level of governance either: Instabee Group’s metrics onion shows how to decide.
Who is responsible for governing metrics in a company?
Usually the data team sets up the process and the catalog. Ownership of individual metrics often sits with the team closest to them: Finance owns revenue metrics, Product owns usage metrics, and so on.
What happens when a governed metric’s definition needs to change?
The owner proposes the change, it gets reviewed, and affected teams are told. The central definition is then updated, and the change appears in every report and AI query that uses the metric. Version history shows what changed and when.
How is a governed metric different from a certified report?
A certified report is a specific output that has been reviewed and approved. A governed metric is the underlying definition behind any report or analysis. If you govern the metrics, every report built from them is consistent.

Book a demo
Get help with exploring the platform and discussing use cases for your team.
Get started
Explore for free. Get your own workspace or try the demo setup.
More posts