September 22, 2026
Tables reimagined
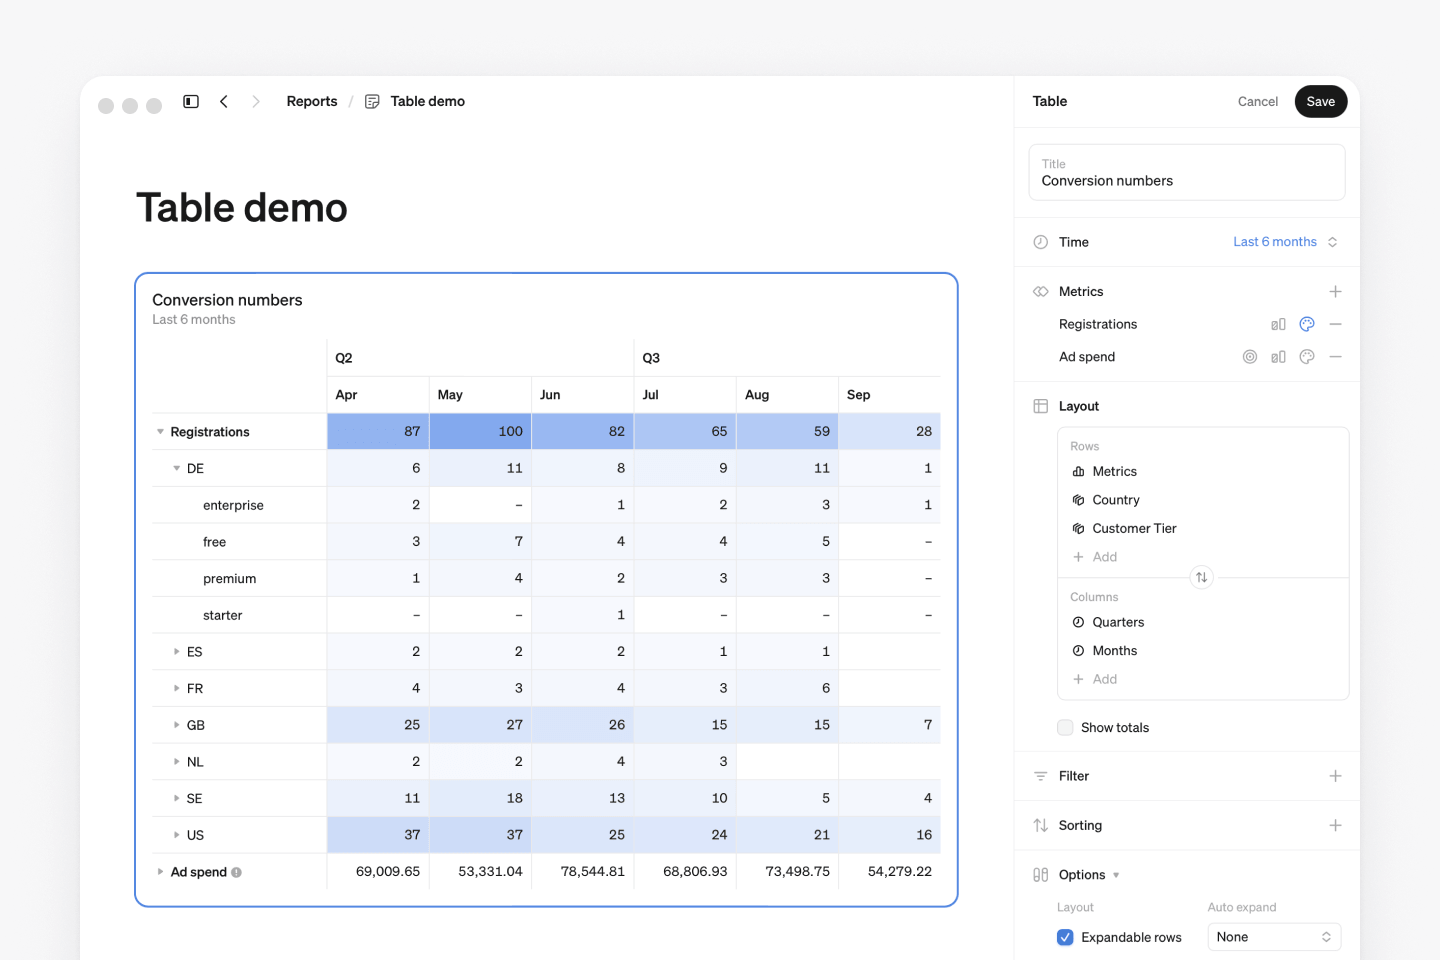
Multiple metrics, multiple breakdowns, comparisons, targets and totals in the same table. Building tables with this much depth has never been easier.
Any number of breakdowns, on both axes
Stack as many breakdowns and time grains as you need, on the rows, the columns, or both. Their order sets the hierarchy, and the transpose icon flips the whole layout at once.
Expandable rows
Switch on Expandable rows and the table groups by your row hierarchy, or leave it off and see every row at once. Click a row to open the level below it and explore as far as the question goes.
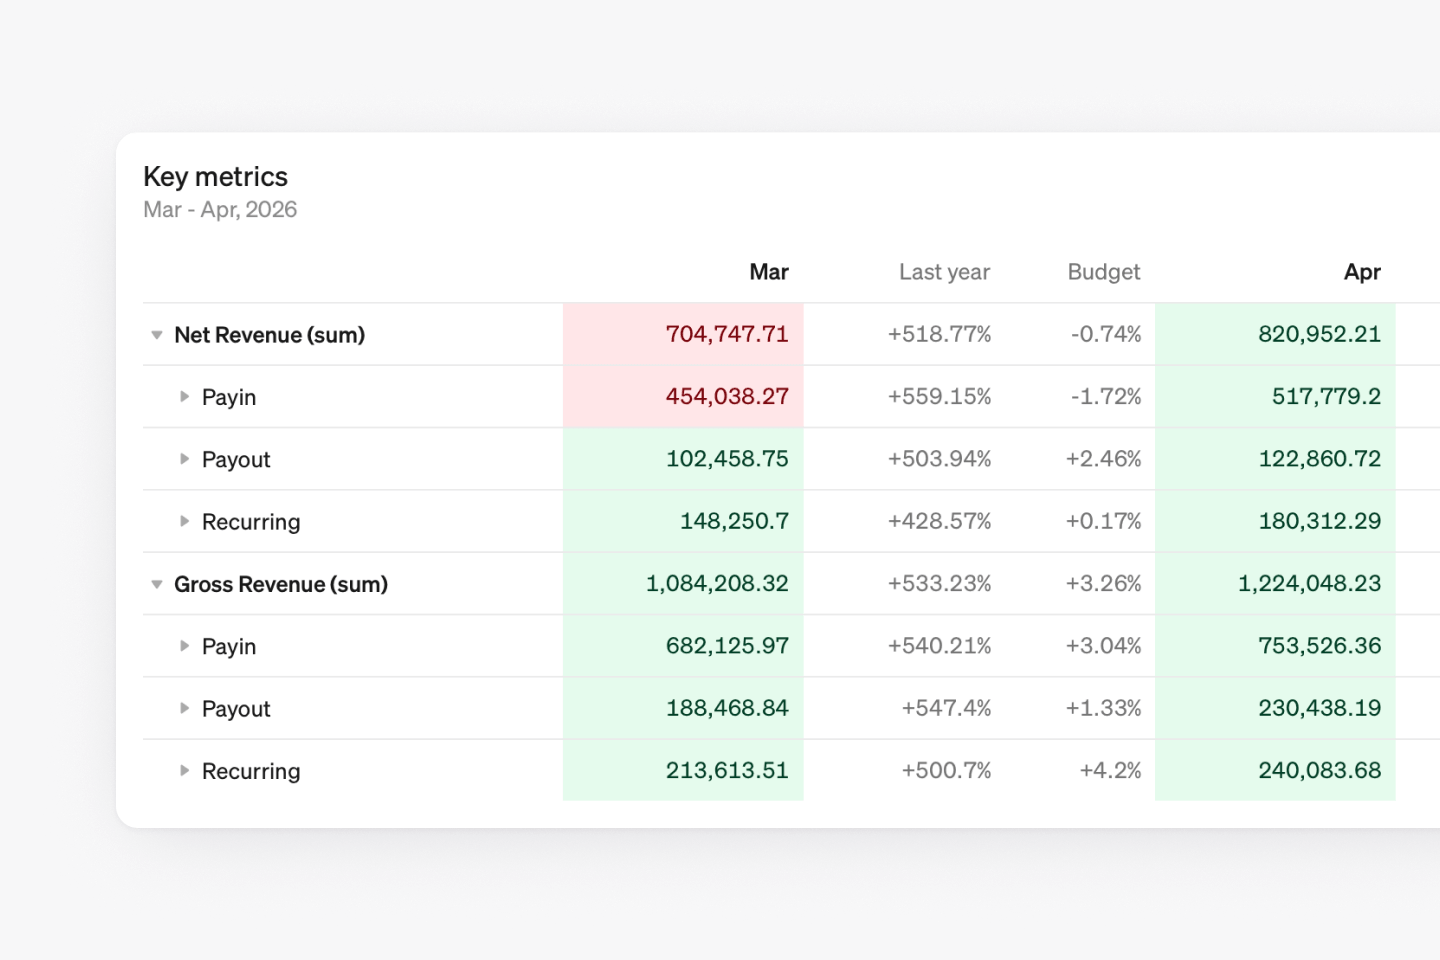
Comparisons and targets on every metric
Add a comparison to a metric and change and change in % come with it. Metrics with a target in your semantic model bring the target in with one click, and targets follow the hierarchy all the way down. Show either as rows under each metric, or as columns beside the value they measure against.
Show totals
Switch on Show totals in the Layout section and the table adds a total row, a total column, or both, depending on where your breakdowns sit. Totals only appear where the metric supports them, so nothing gets summed that shouldn't be.
Sorting and Top X filters
Rows and columns sort independently, so you can lead the columns with the most recent month and rank the rows by what happened in it. Limit a breakdown to its biggest values and it applies inside the hierarchy.
And more
- Long metric and dimension names are handled better
- Steep AI can create tables for you
- All table configuration has moved into the edit panel
- Expandable tables can auto-expand to any level
- The current row and column highlight on hover
- Gridlines can be switched on
Tables have been rebuilt from the ground up, with everything set in one edit panel: no SQL, no table calculations, no plugins. If you knew the old tables, everything you could do you still can, and the help center covers what moved where.