November 10, 2023
Metric tables
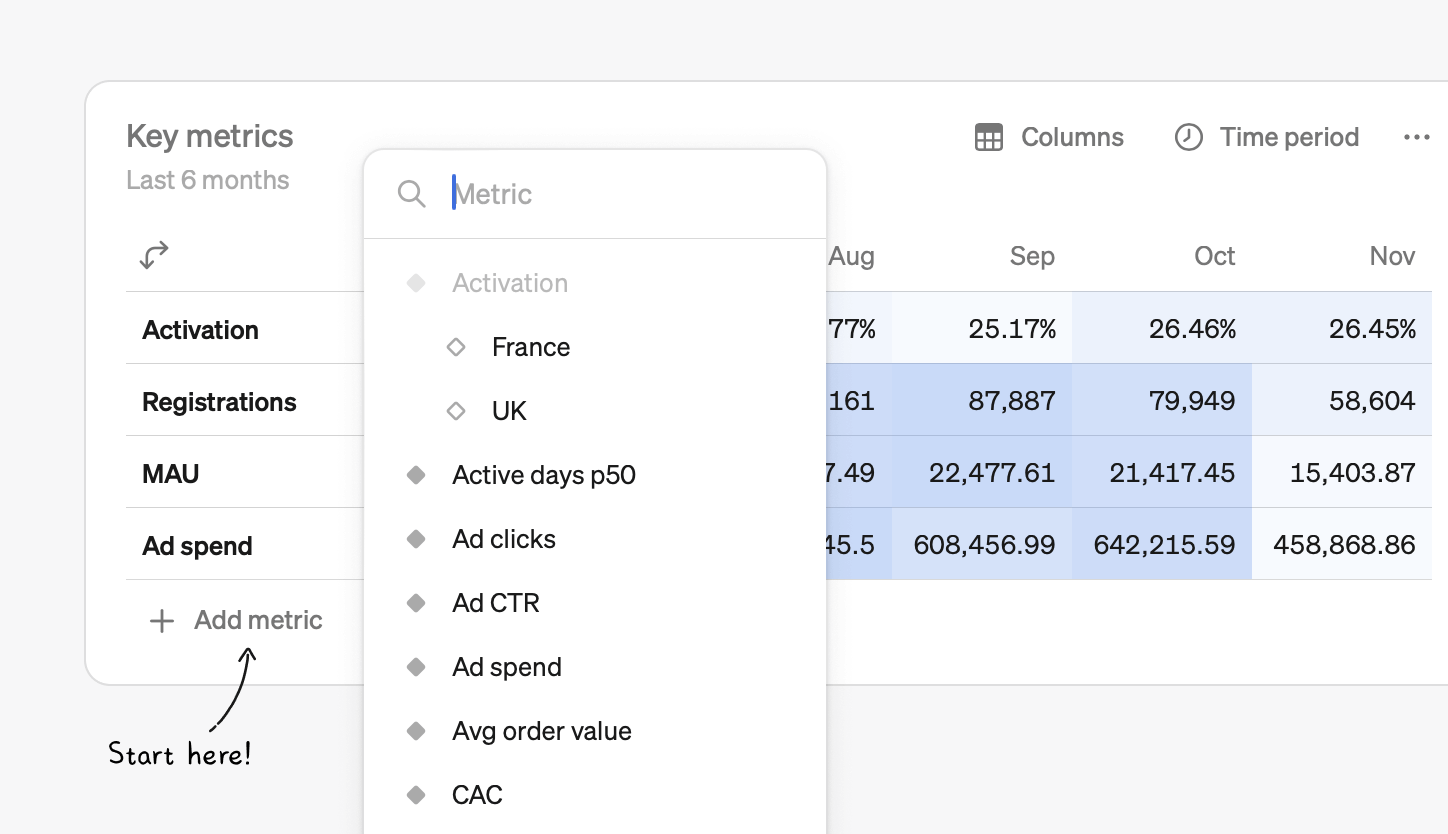
No matter what new, fancy visualization comes around, sometimes you just want a good old table. But just because they have been around forever doesn’t mean they can’t be improved. We've supercharged tables to be powerful, flexible and user-friendly so everyone can easily compare multiple metrics over time and across dimensions. They’re simple, powerful, and a joy to work with.
Create powerful, dynamic tables in no time
You can add a table block to any report in just two clicks, and then add any number of metrics from your catalog to the table. Once your metrics are added, there are countless ways to customize and analyze your data.
Time or dimensions
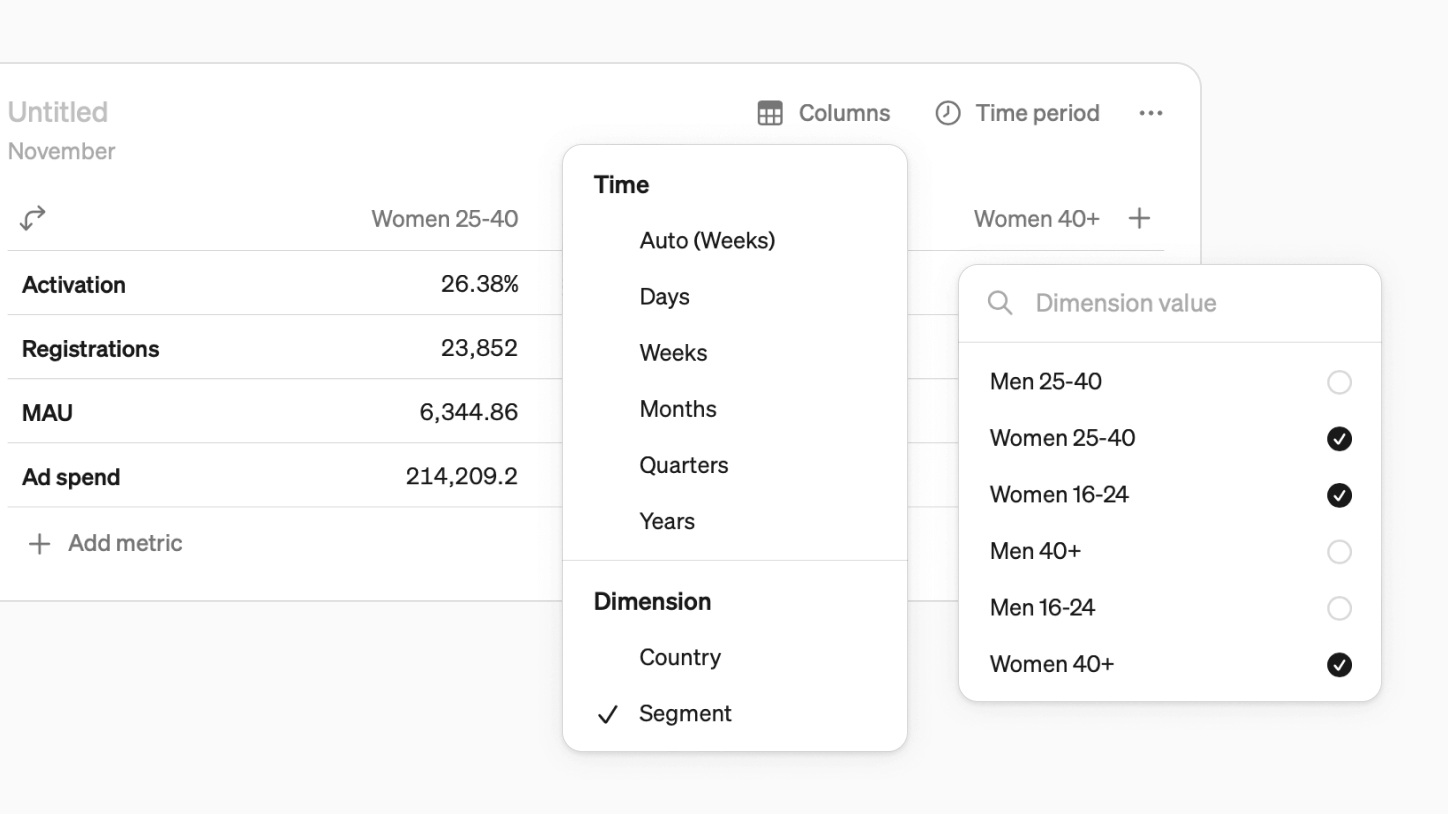
On the second axis, you can have either time or the values of a dimension
- Time can be set to days, weeks, months, quarters, or years. There is also the default “auto” option, where Steep chooses the most relevant time grain based on the table’s time period.
- Instead of time, you can select a common dimension and pick any values from it—for example, specific markets or segments.
Compare, targets
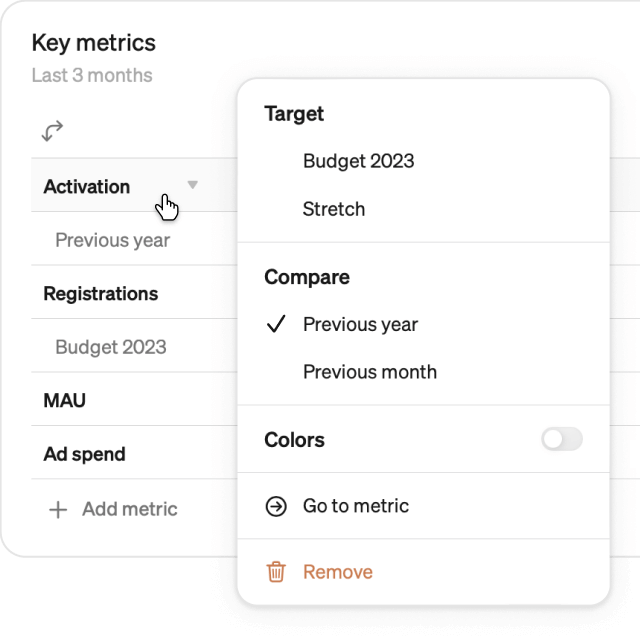
You can attach extra rows or columns to each metric in a table to:
- Compare actuals to targets - are we on track to hit monthly goals?
- Compare to the previous year or time period - how much are we growing month over month?
Add color
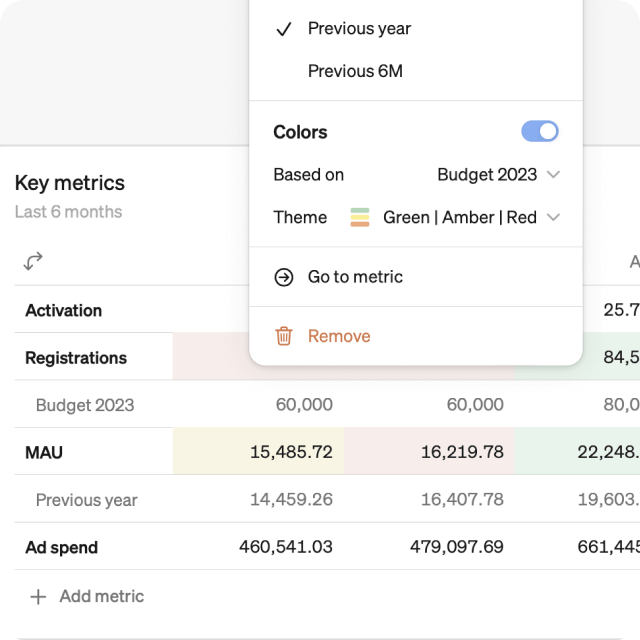
See the big picture easier with color highlighting:
- Color table cells based on values, or based on values vs. compares and targets
- Choose from different color themes: monochrome gradient, red-green, red-amber-green
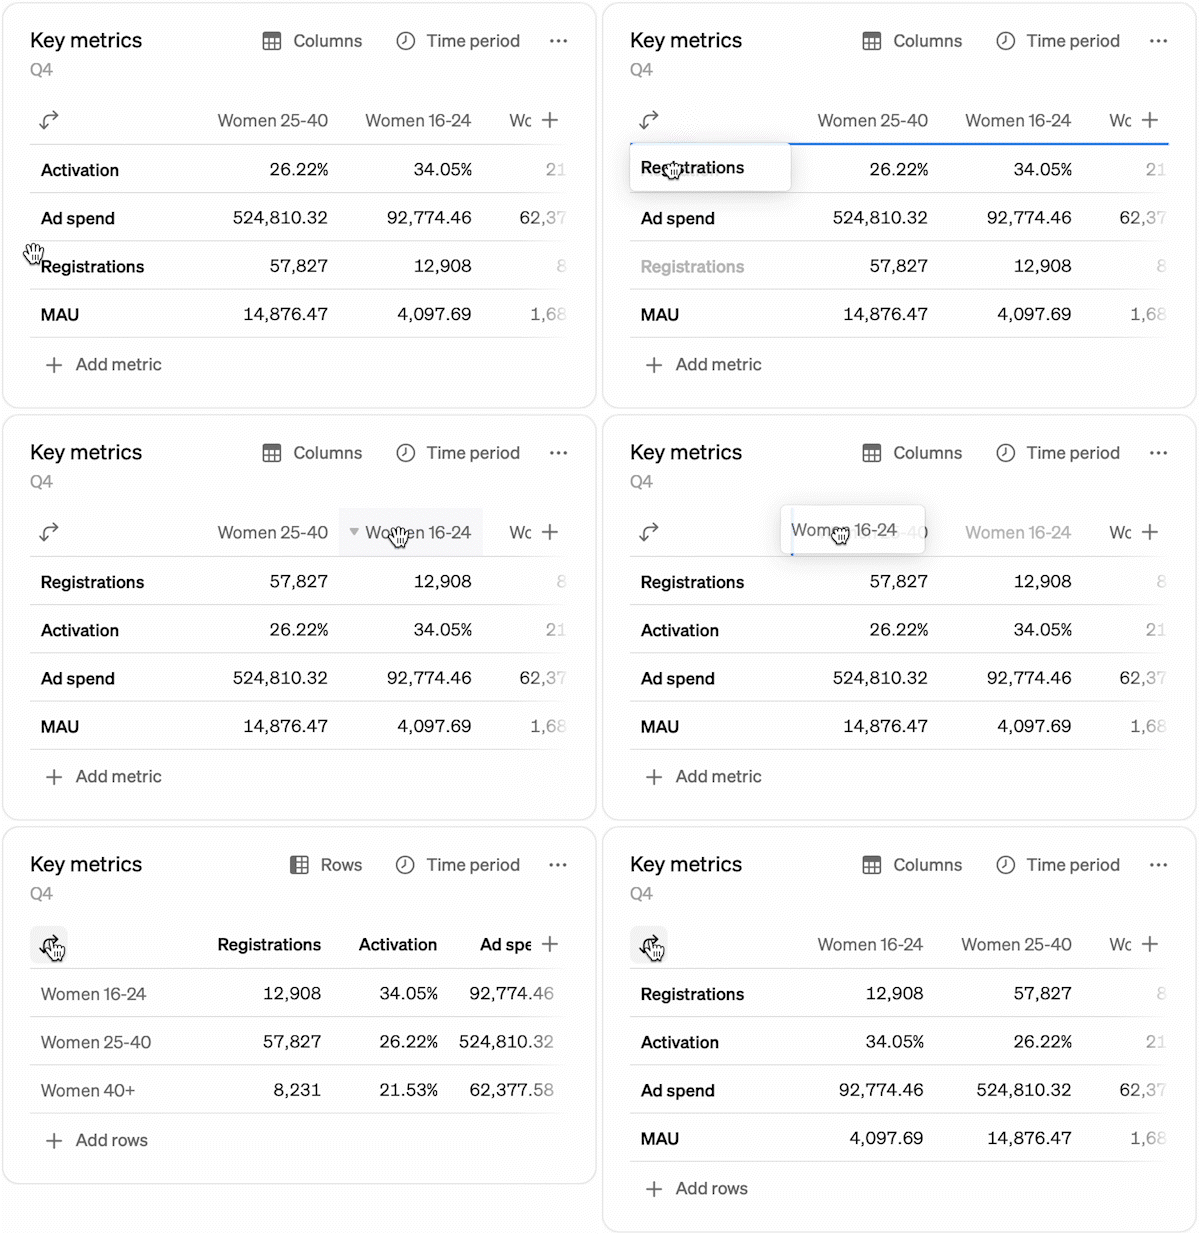
Drag and drop, transpose
- Metrics and dimensions can be re-arranged by dragging and dropping
- Hit the transpose button to flip the table (╯°□°)╯︵ ┻━┻
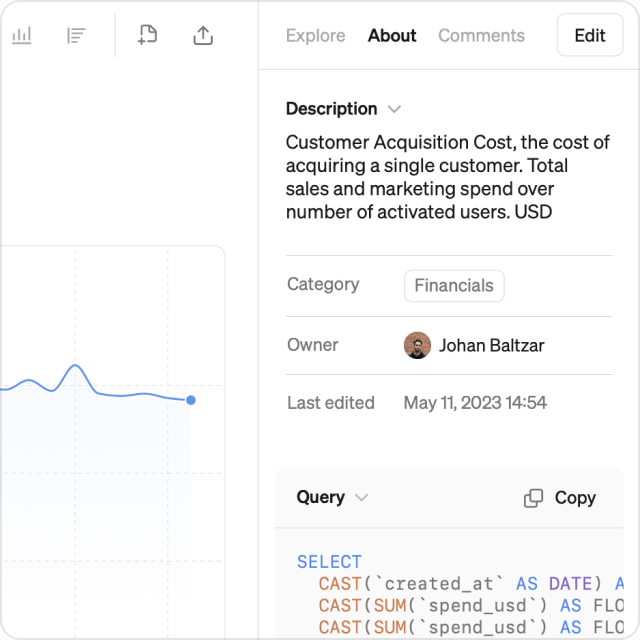
Also new this month: About tab
- We have collected metric descriptions, categories and owners under the new About tab in the Explore view
- Here users can also view the SQL query that is generated for the chosen view