March 1, 2024
Pivot tables, targets and more
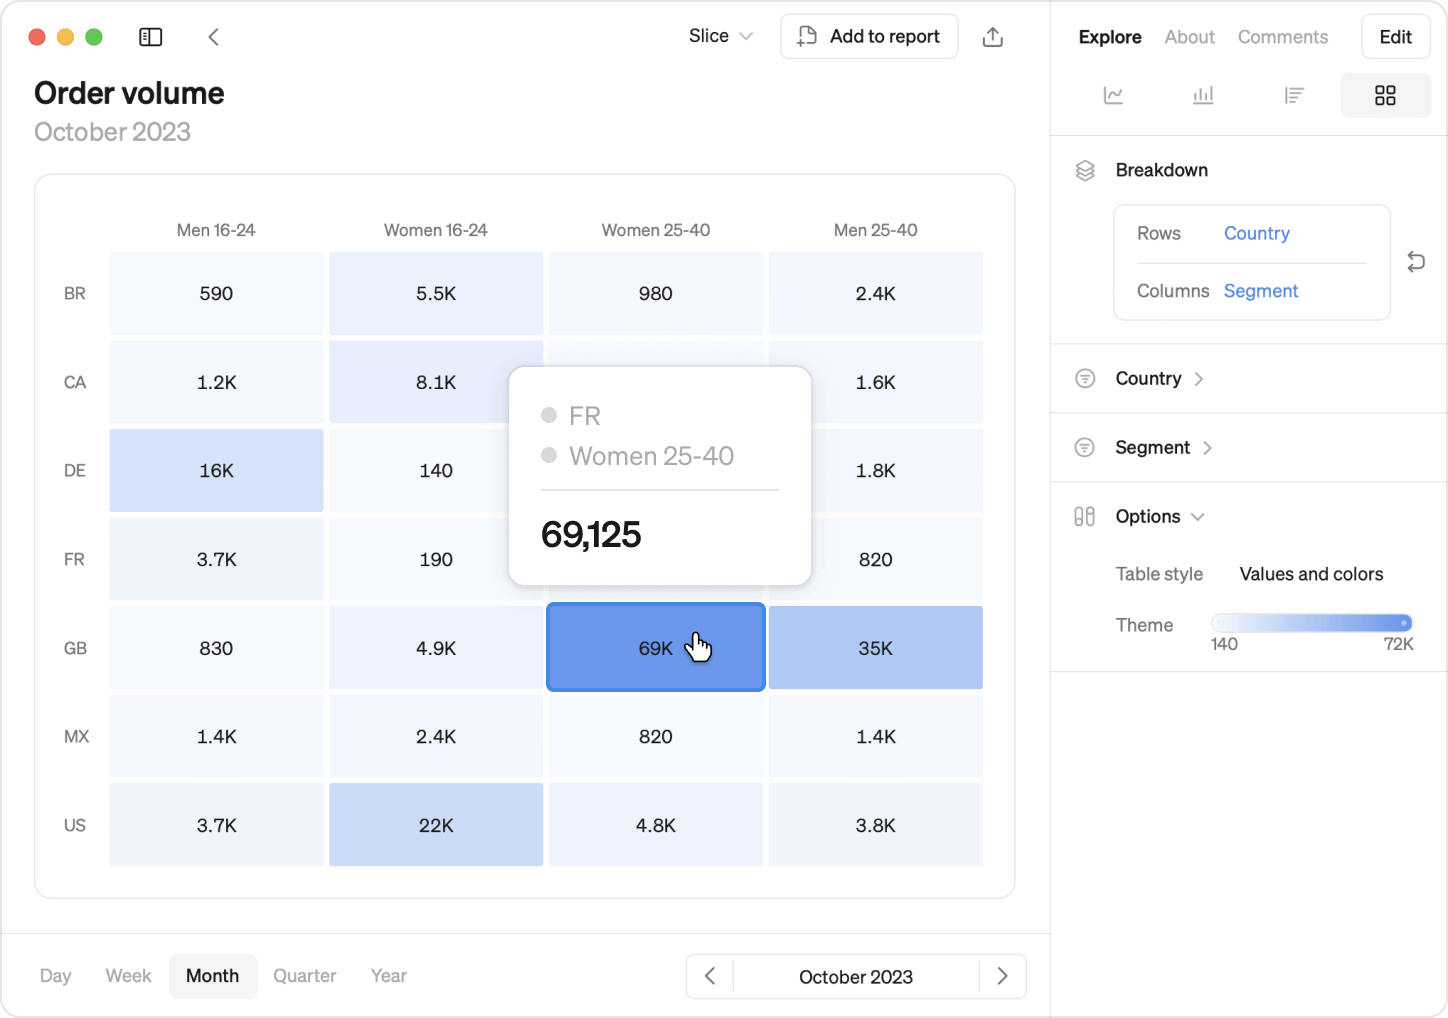
Introducing Pivot Tables
Pivot tables allows you to break down metrics by two dimensions, offering deeper insights into your metrics's dynamics. Color code the pivot table to make it easier to spot trends and outliers.
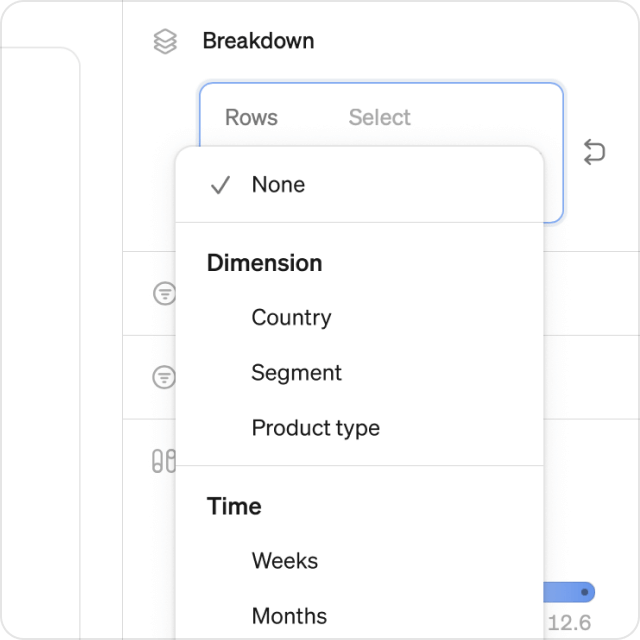
Break down over dimensions or time
Use any two dimensions as rows and columns, for example markets vs segments. You can also use time as one of the axis, like weeks, months or years.
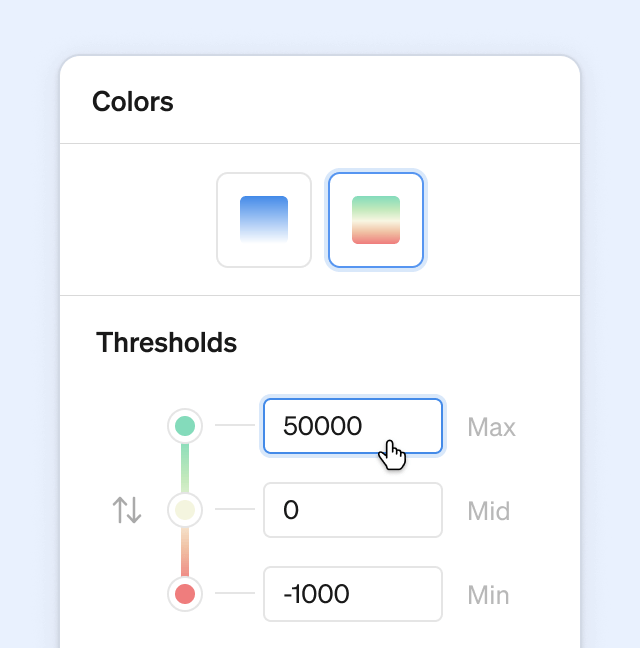
Color control
Create a heat map using one of the built-in color themes, and fine-tune the color thresholds to make the data speak to you.
Flexible, powerful
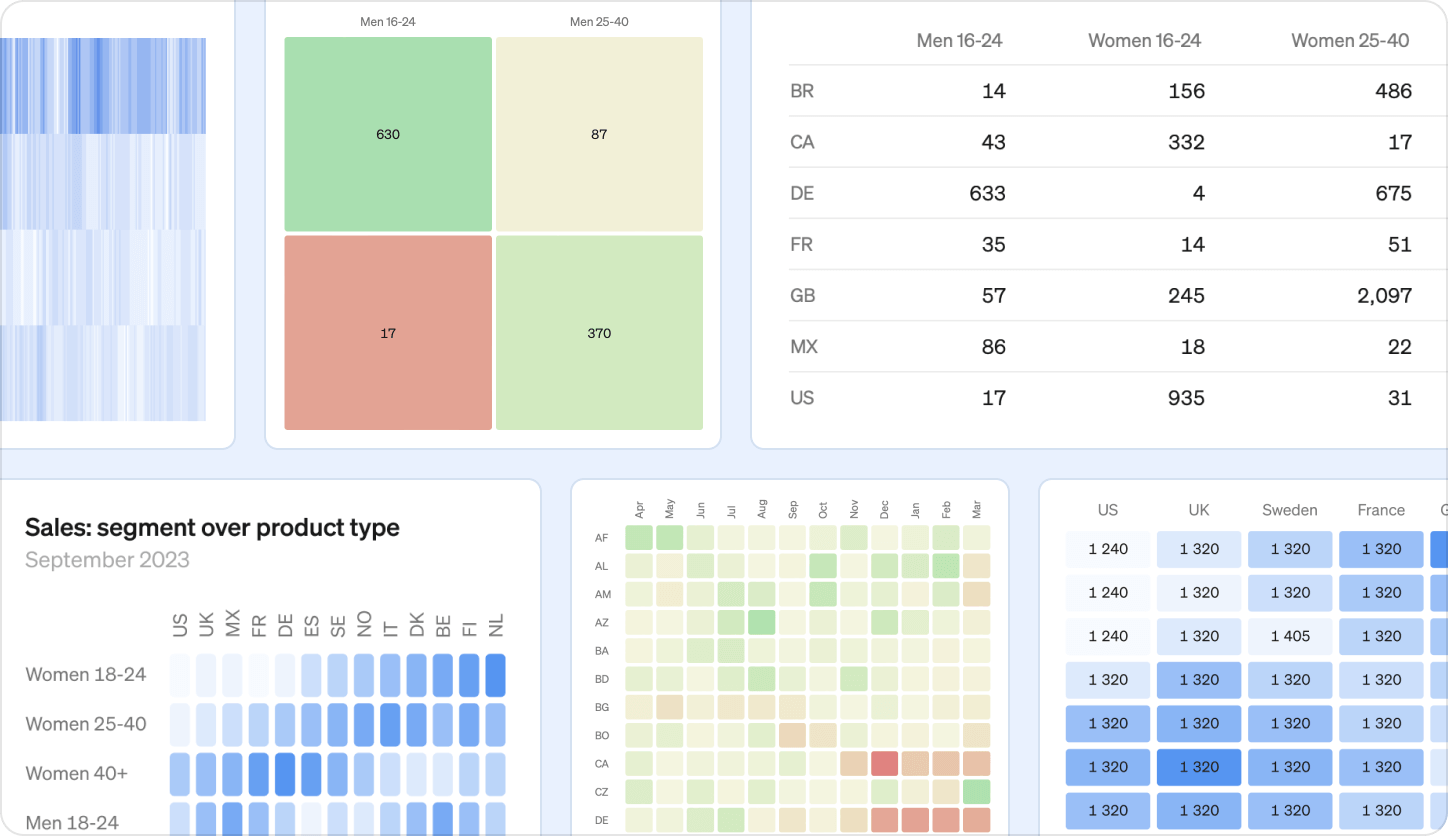
Pivot tables are highly customizable and scales to fit any size and amount of data. The are available in the explore view and can be added to any report. And of course, they work great on mobile too. Pivot tables can be used with any metric with at least one dimension.
Targets upgraded
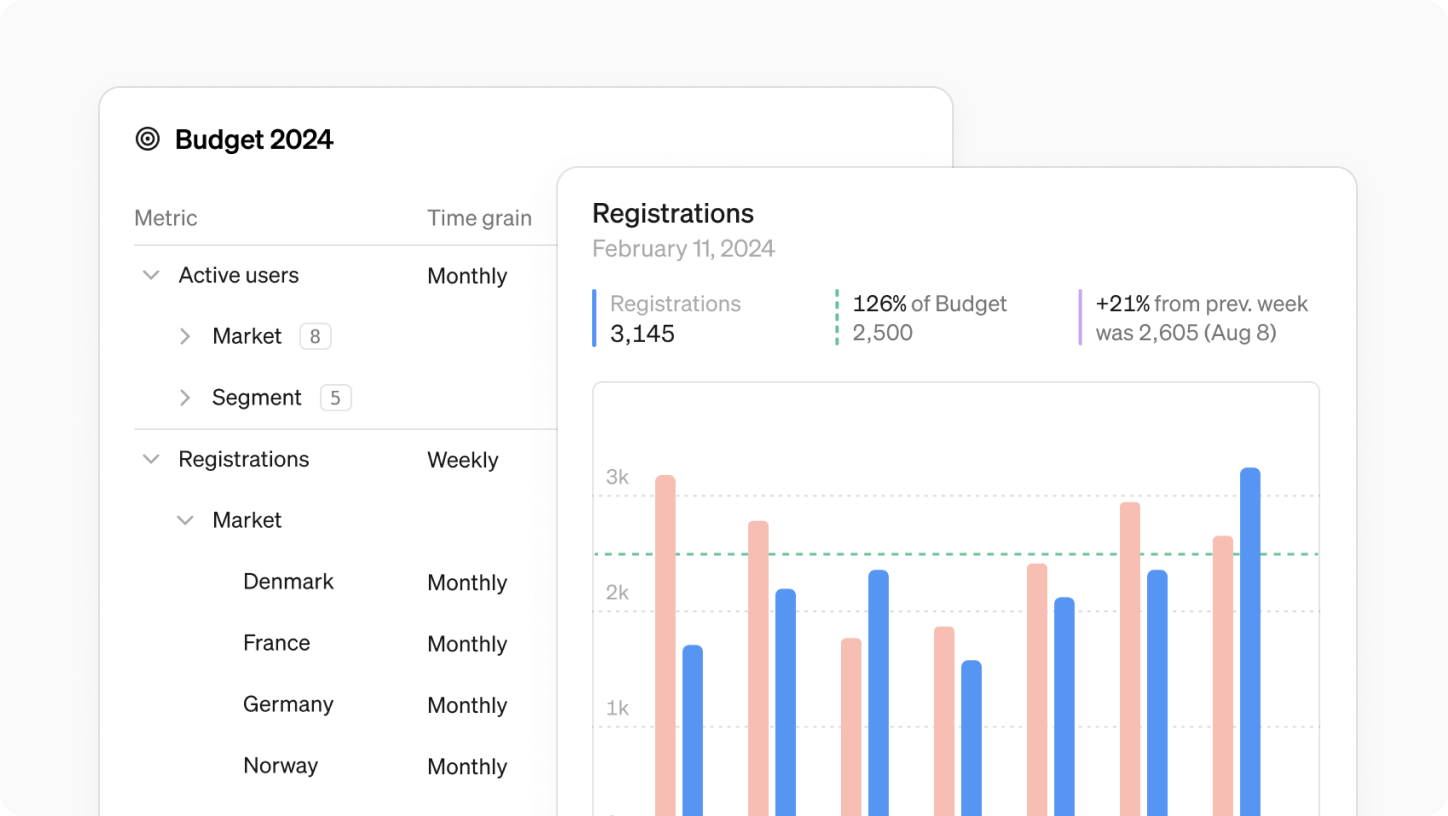
- Set targets on any time grain, no longer limited to monthly.
- Define targets not only for metric totals but also for dimension values.
- Targets load much faster with our new caching.
Check our help center for more details →
Pin Reports
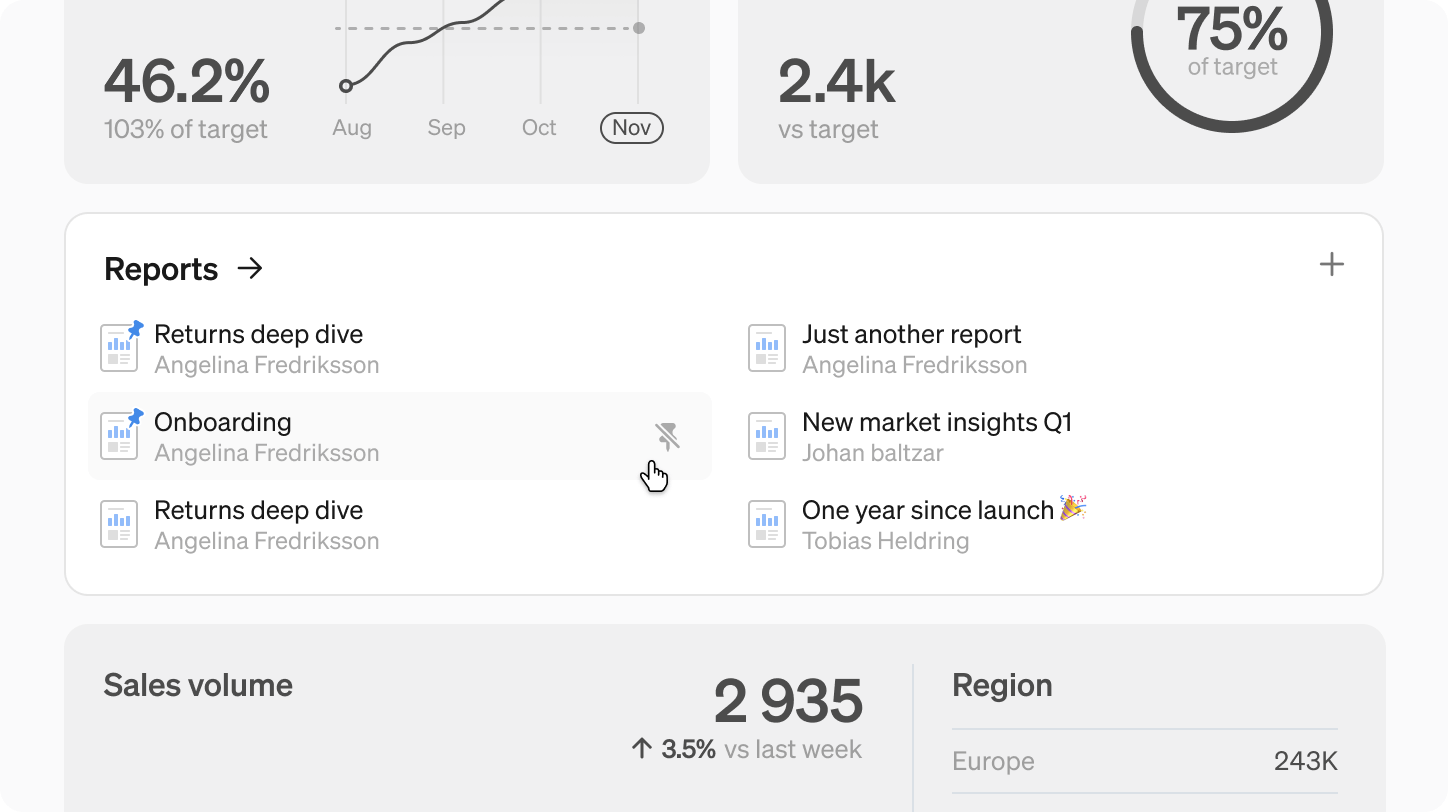
- Shared reports are now easy to find on your home screen.
- Team-specific reports find their place in respective team spaces.
- Pin important reports for easy access on the home screen or team space.