June 25, 2025
Put your metrics on the map
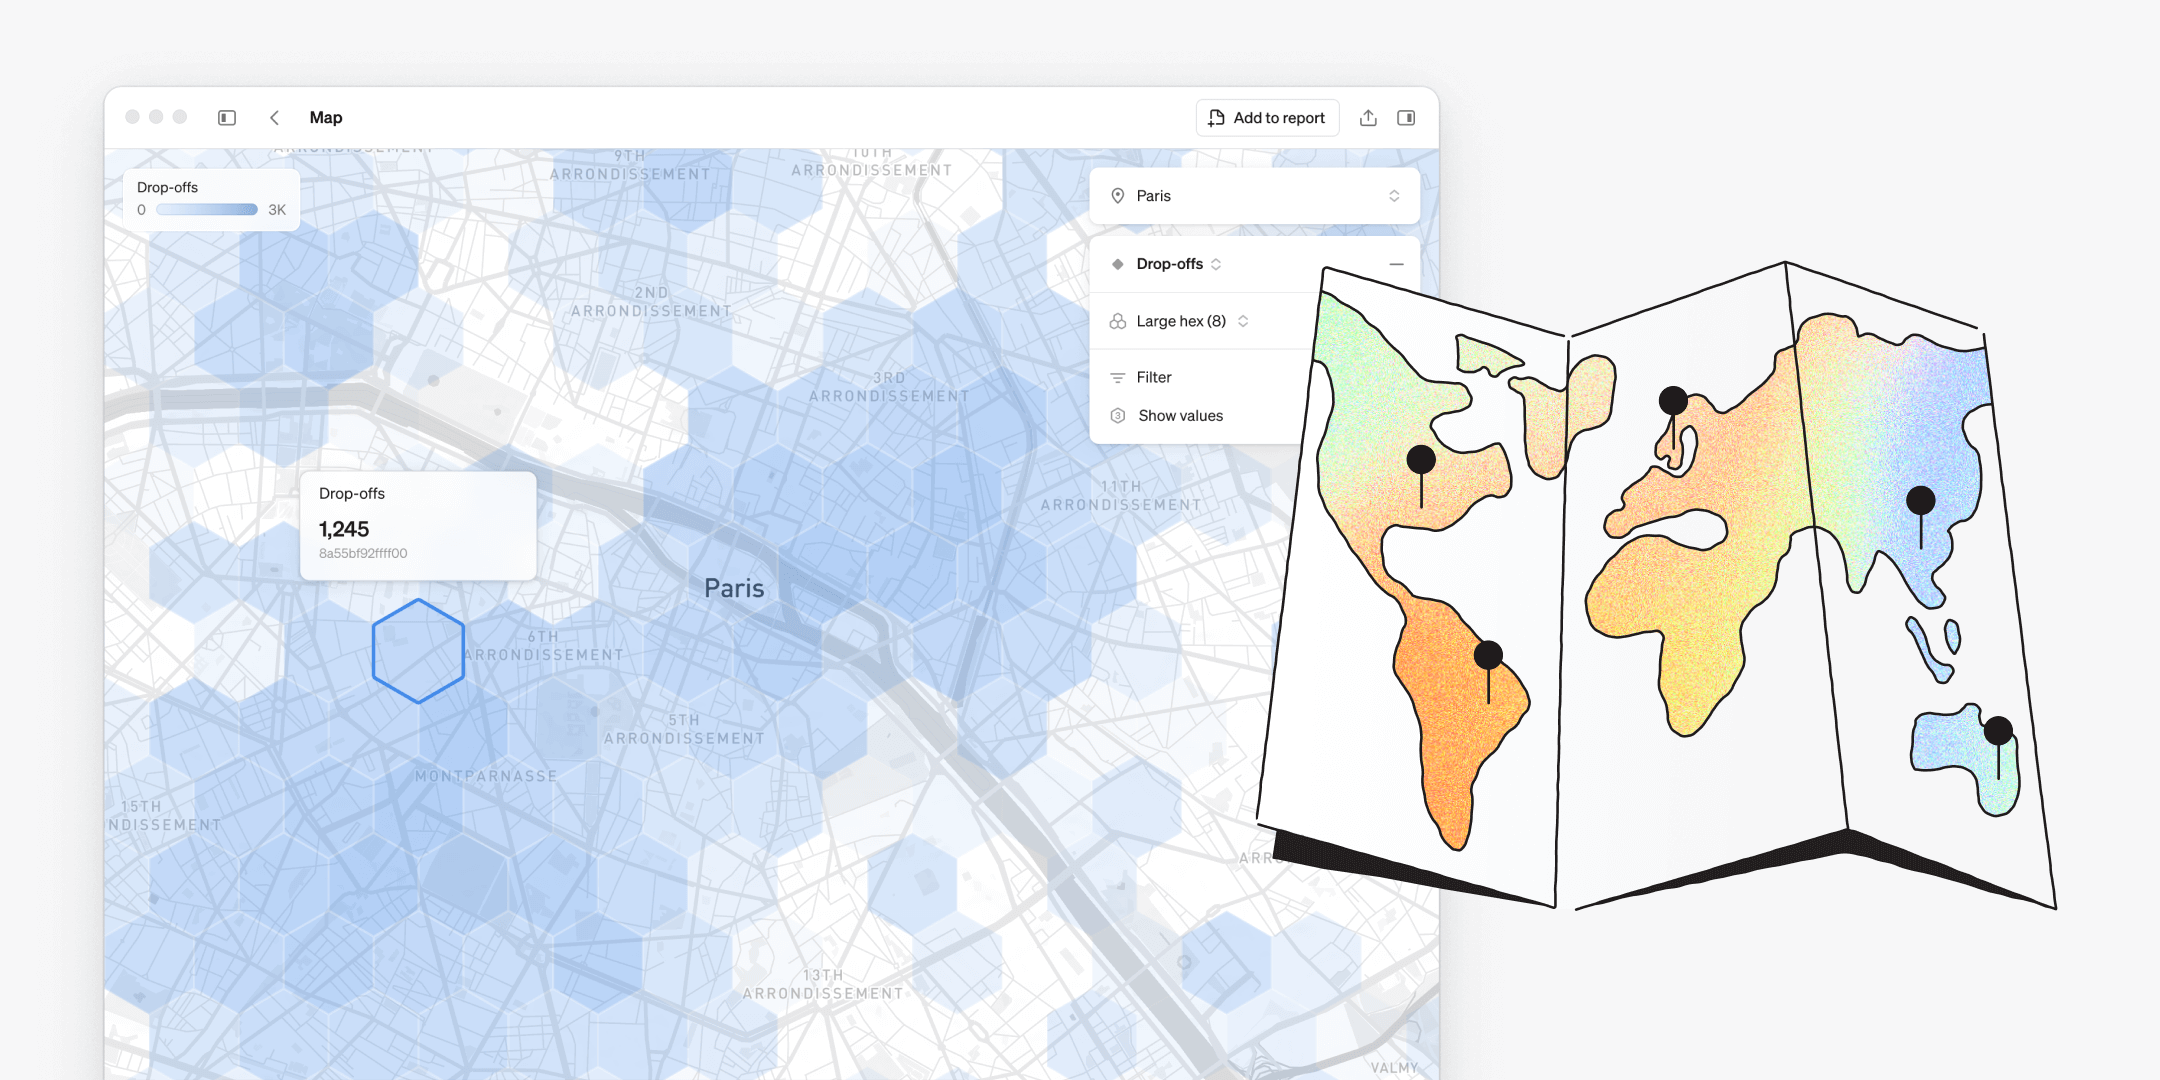
A new approach to maps
Traditionally, maps were time-consuming to build, required a specialist and offered limited flexibility for end users. With maps in Steep, anyone can create rich, location-based visualizations in seconds – fully integrated with the semantic layer.
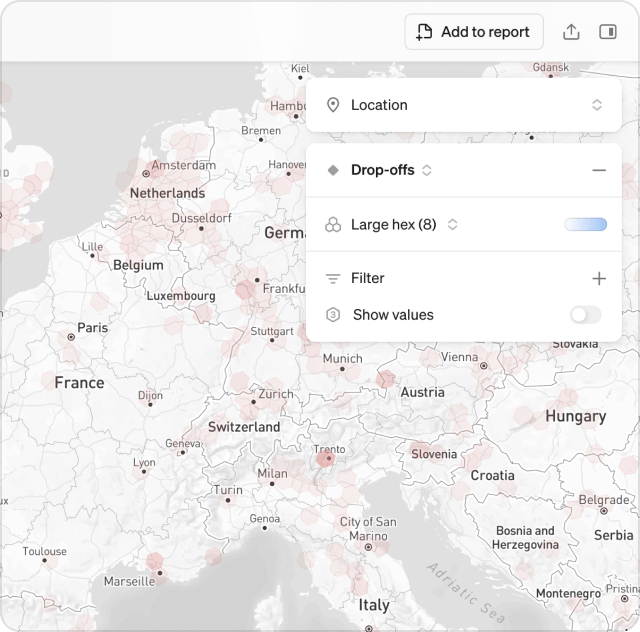
Steep introduces a new take on maps in BI – simple, intuitive, and made to be explored by everyone. Just open the map and dive into your metrics instantly.
- Add real-world context to any metric with geo-data in seconds
- Explore location-based trends and patterns flexibly
- Create customized map visualizations to track and compare performance across locations
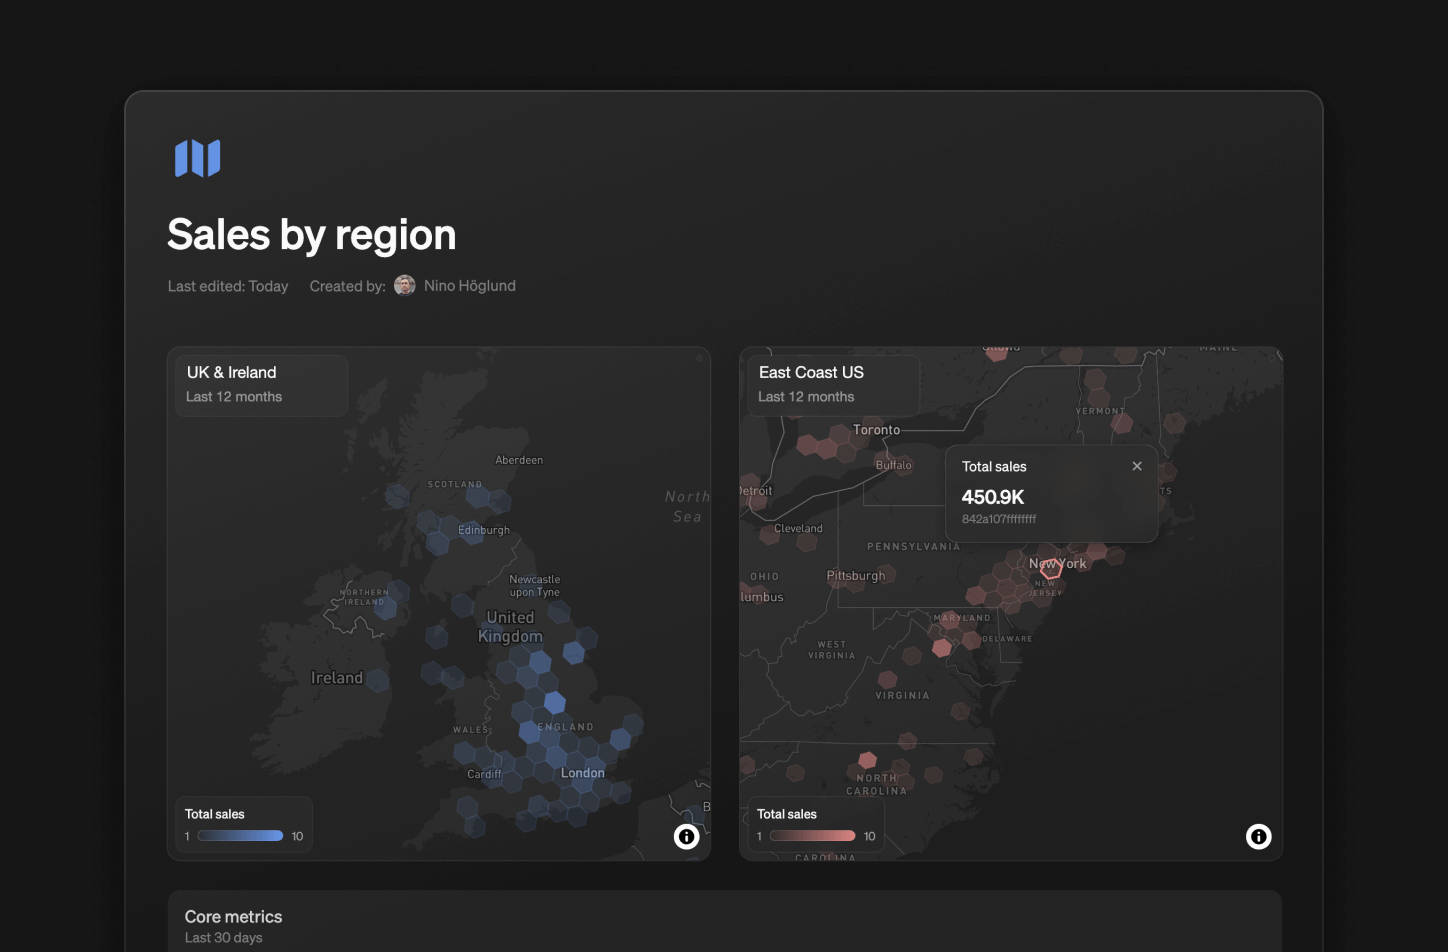
Add unlimited map blocks to your reports to track and compare the performance of different metrics, time periods, or regions – side-by-side.
Discover the world in H3
Steep uses the global H3 cell index format to bring your data to life on a hexagonal grid. The H3 cell index format makes spatial analysis in BI simple, scalable, and precise:
- Consistent hexagonal grid for clean comparisons
- Multiple precision levels, from country to street view
- Smooth aggregation and zooming across locations
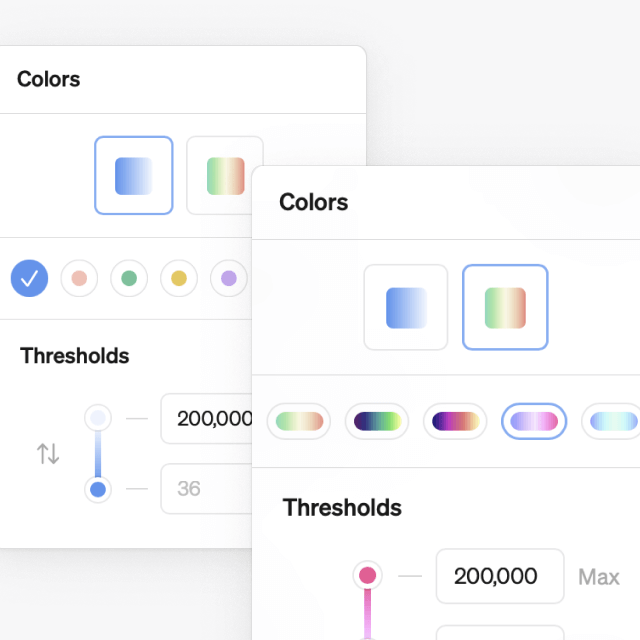
Customize your maps
Choose from 12 color schemes to find the perfect visualization for each use case, and color-code your maps neatly in reports.
Get started
To put your metrics on the map, convert your geographic data to H3 cell index format. Once set up, everyone in your workspace can start exploring maps freely.