September 16, 2023
Next-level analysis
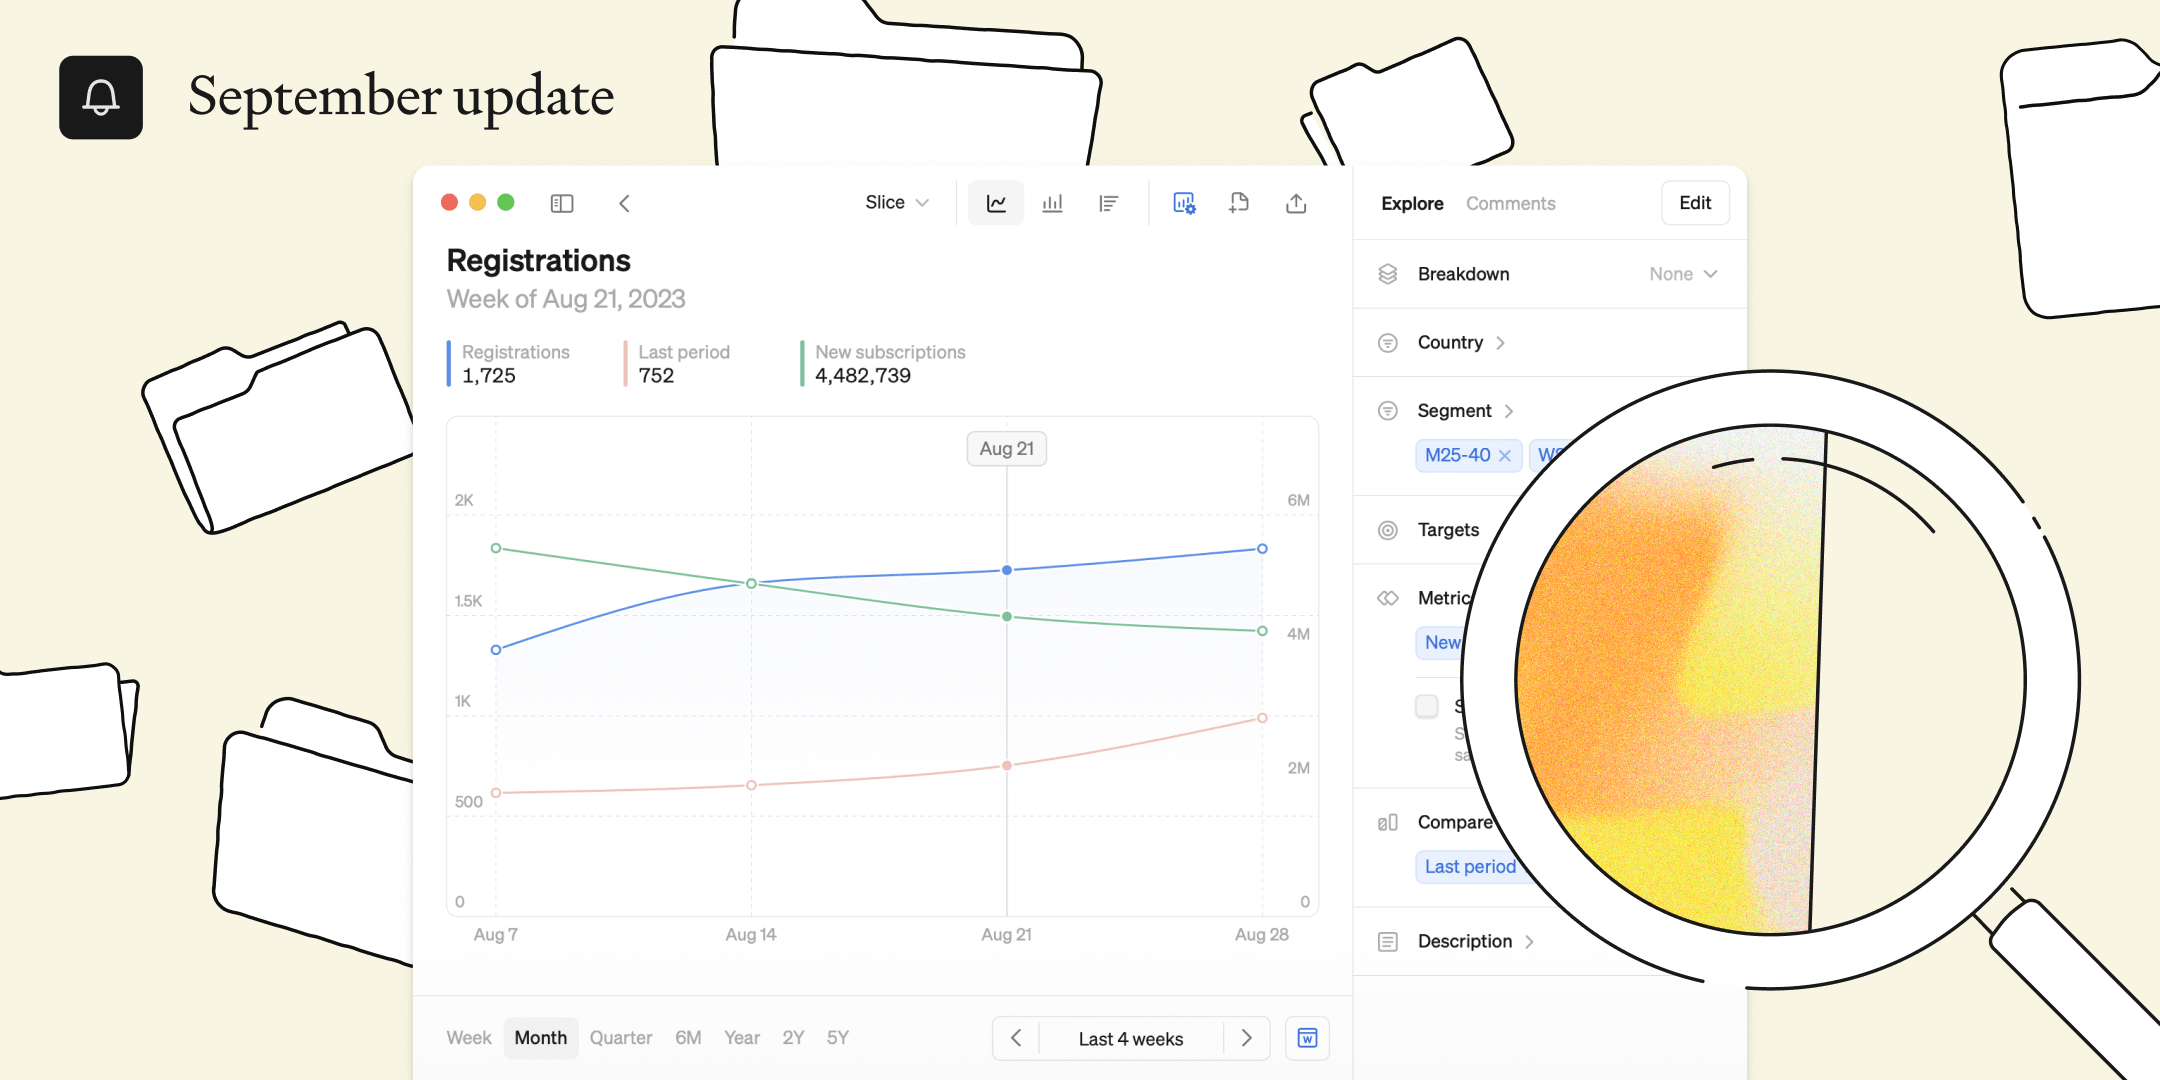
Dive deeper
At Steep, we’re building a BI platform that can be used by the whole organization, because at a data-driven company everyone needs to have access to their business data. This month we’re excited to introduce even more flexible analysis capabilities that let entire organizations delve into the data in a super user-friendly and intuitive way.
Flexible filters for precise insights
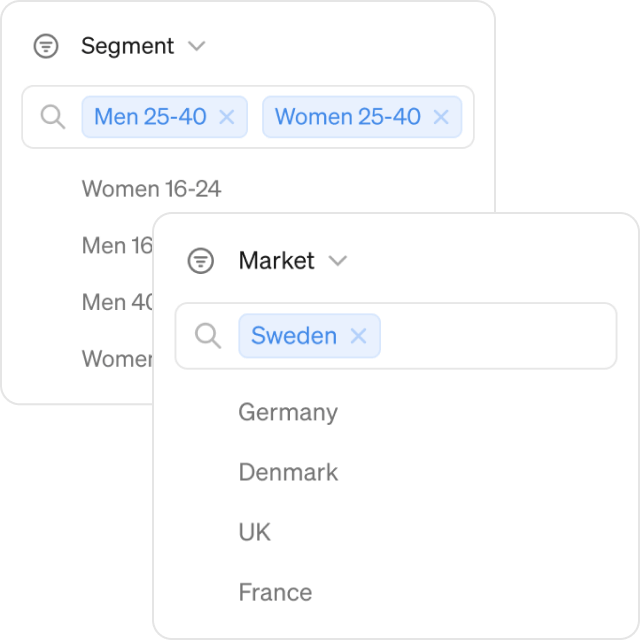
First, we've upgraded our filters to provide you with even more control. You can now apply multiple filters in multiple dimensions simultaneously. Letting any user drill down and understand, say, how specific segments in Germany is performing.
Additionally, we've added an easy search function for filters to quickly find the specific cut of data you need, saving you valuable time when navigating large dimensions.
Combine multiple metrics
To understand the full picture, you can’t just look at metrics in isolation. That’s why we’ve made combinations much more flexible:
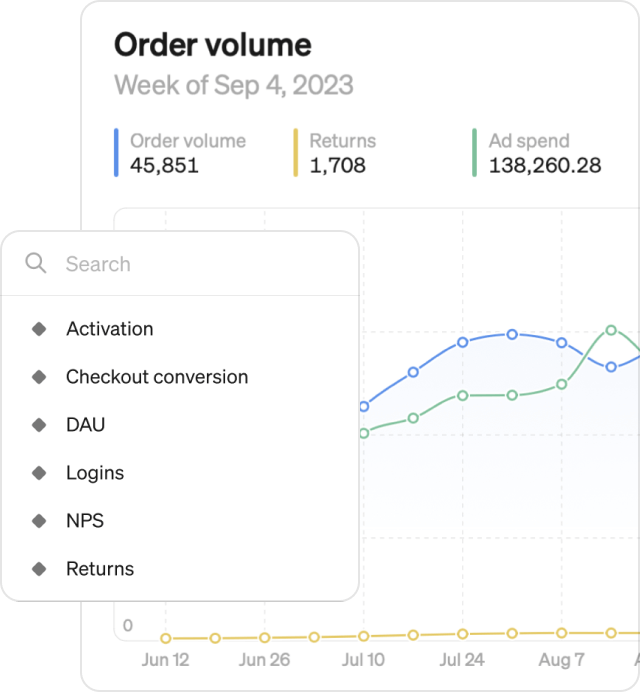
- Overlay multiple metrics against each other on the same graph to see how metrics are evolving compared to one another.
- Second Y axis: Easily compare metrics with different units of measurement on the same graph for a comprehensive view. Answer questions like, how is the increase in conversion rate impacting registrations?
- Search for metrics: Quickly find the specific metrics you want with our quick search function.
Compare it
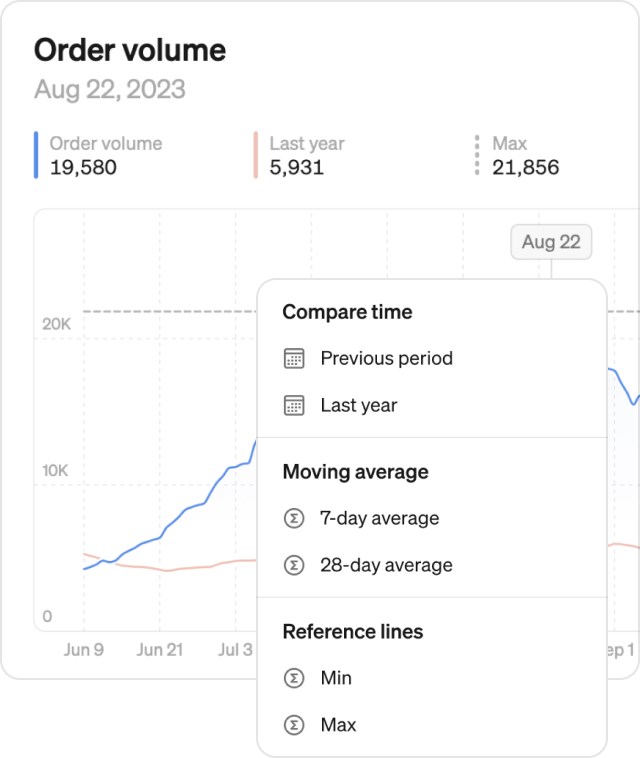
- Time-based comparisons: Compare data from previous period or last year to identify trends and seasonality.
- Moving averages: Quickly add 7-day or 28-day moving averages to your graph.
- Reference lines: Measure growth by adding reference lines for minimum, maximum, and median values.
- Multiple comparisons at once: Add any number of comparisons to the same graph to compose your specific view
Sail through time
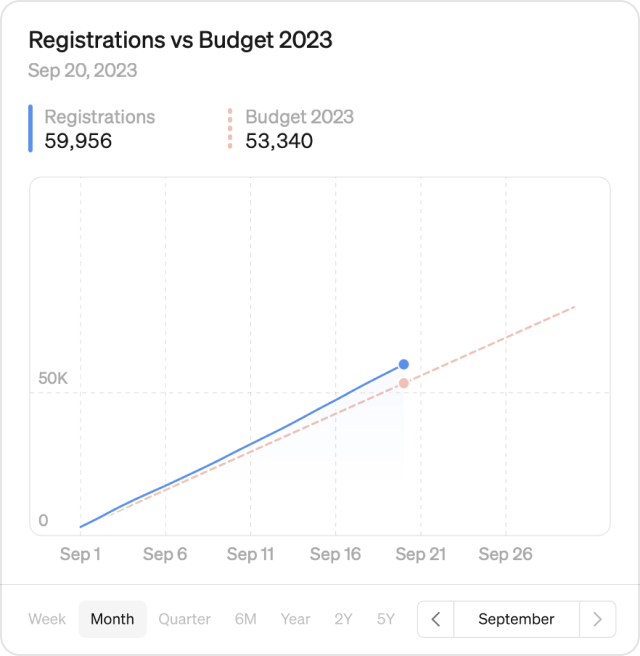
- X-to-date: Navigating through time is now more flexible than ever — you can now look at year-to-date, quarter-to-date or month-to-date by simple stepping to the right
- Extended zoom options: Zoom out to view data over 2 years or 5 years, and get a broader perspective for long-term analysis.
Updated breakdown
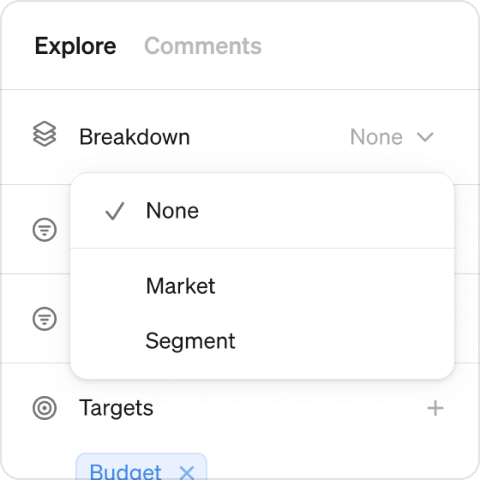
Want to see the number of active users by country? Age? City? No problem. Break down your metric in any dimension you have available.
Cumulative mode
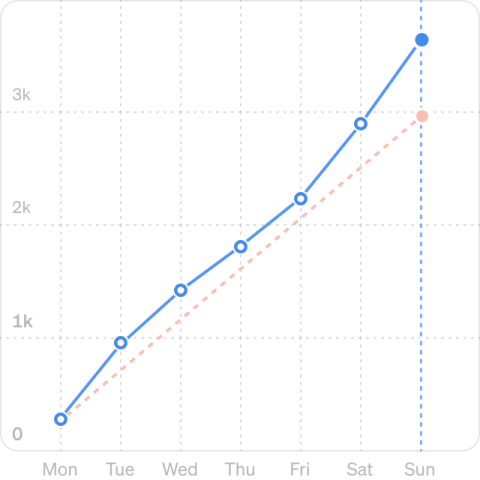
How are we growing so far this month? Are we on track to hit targets? This is now easy to answer with the new cumulative mode. Switch to cumulative and see how your intra-month volume is growing day-by-day. Compare to last month or to targets for a clear view of performance.
Add to report
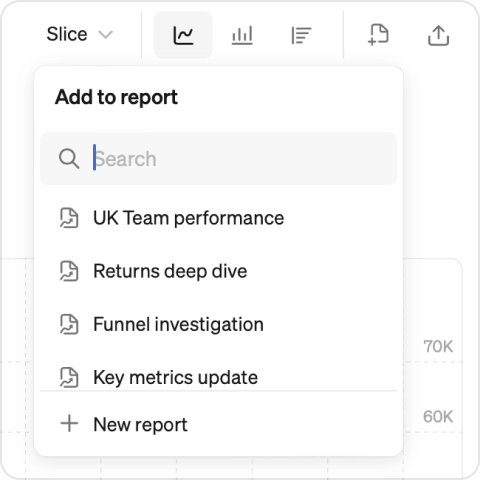
Once you’ve created a masterpiece, you can save the graph directly to a new or existing report.
Try these new features now:
Did you know you can test out Steep yourself using demo data? It’s 3 steps and takes less than 30 seconds (we timed it 🧭).
- Sign up using your Google, Apple or Microsoft account
- Name your workspace (this can be changed later)
- Pick “Try Steep with demo content” on the main screen