June 2, 2026
Favorites & updated sidebar
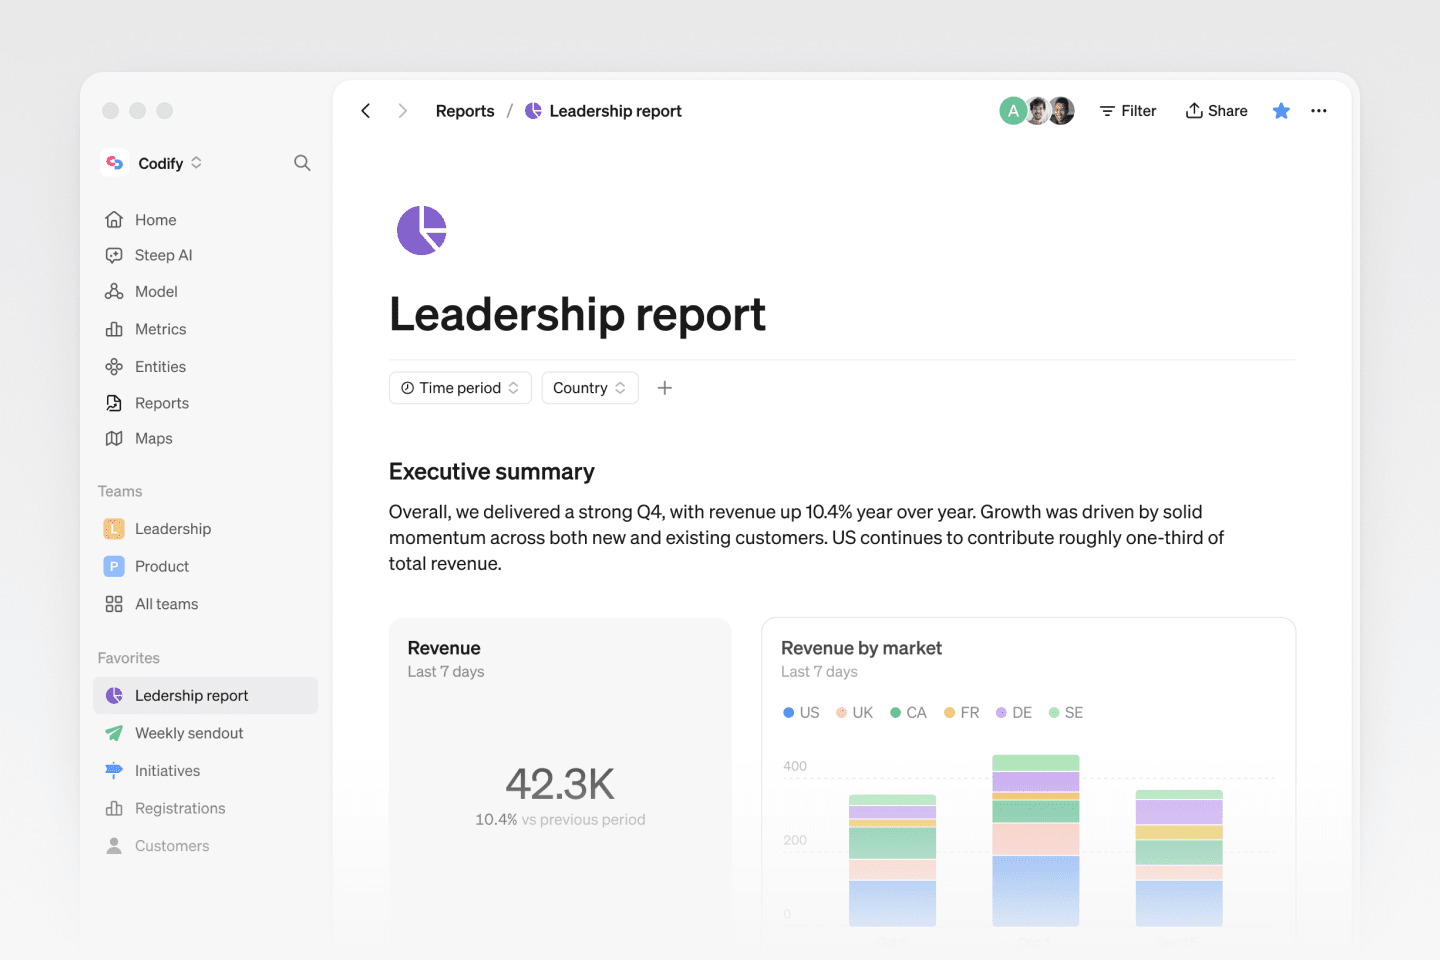
We've reorganized the left nav to surface what matters most. Metrics and Entities now sit at the top level, above Teams, so you can quickly access your most-used data. Collapse these sections to keep your nav compact, or expand them to see all your metrics and entities at a glance. A new Favorites section at the bottom lets you pin any metric, report, or entity for one-click access.
Customize your visualizations
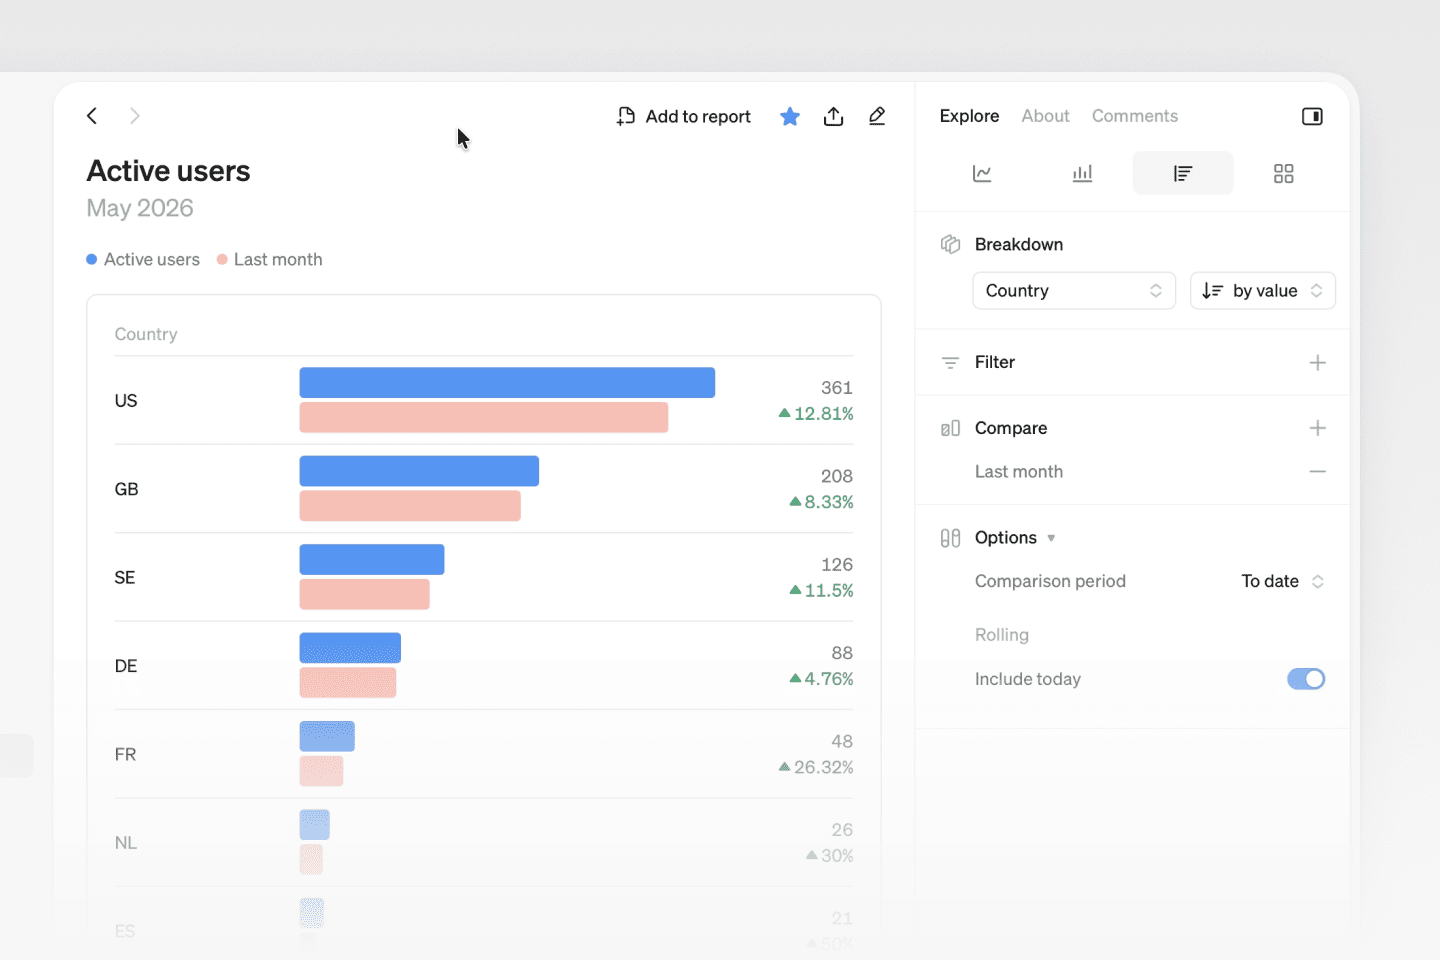
Rolling calendar periods: Set visualizations and report filters to track current periods, which will update automatically as each new period begins. We've also added the last completed periods (last week, month, quarter, year) for snapshots of finished periods.
To date comparisons: A single click now lets you align comparisons to matching points in time. In the options from any visualization(charts, tables, big numbers and widgets), you can choose whether the comparison period should be the full period or to date. This is availiable for metrics with a daily time grain.
Table period-over period comparisons Period-over-period comparisons are now also available in report tables.