May 30, 2025
Sharper customization
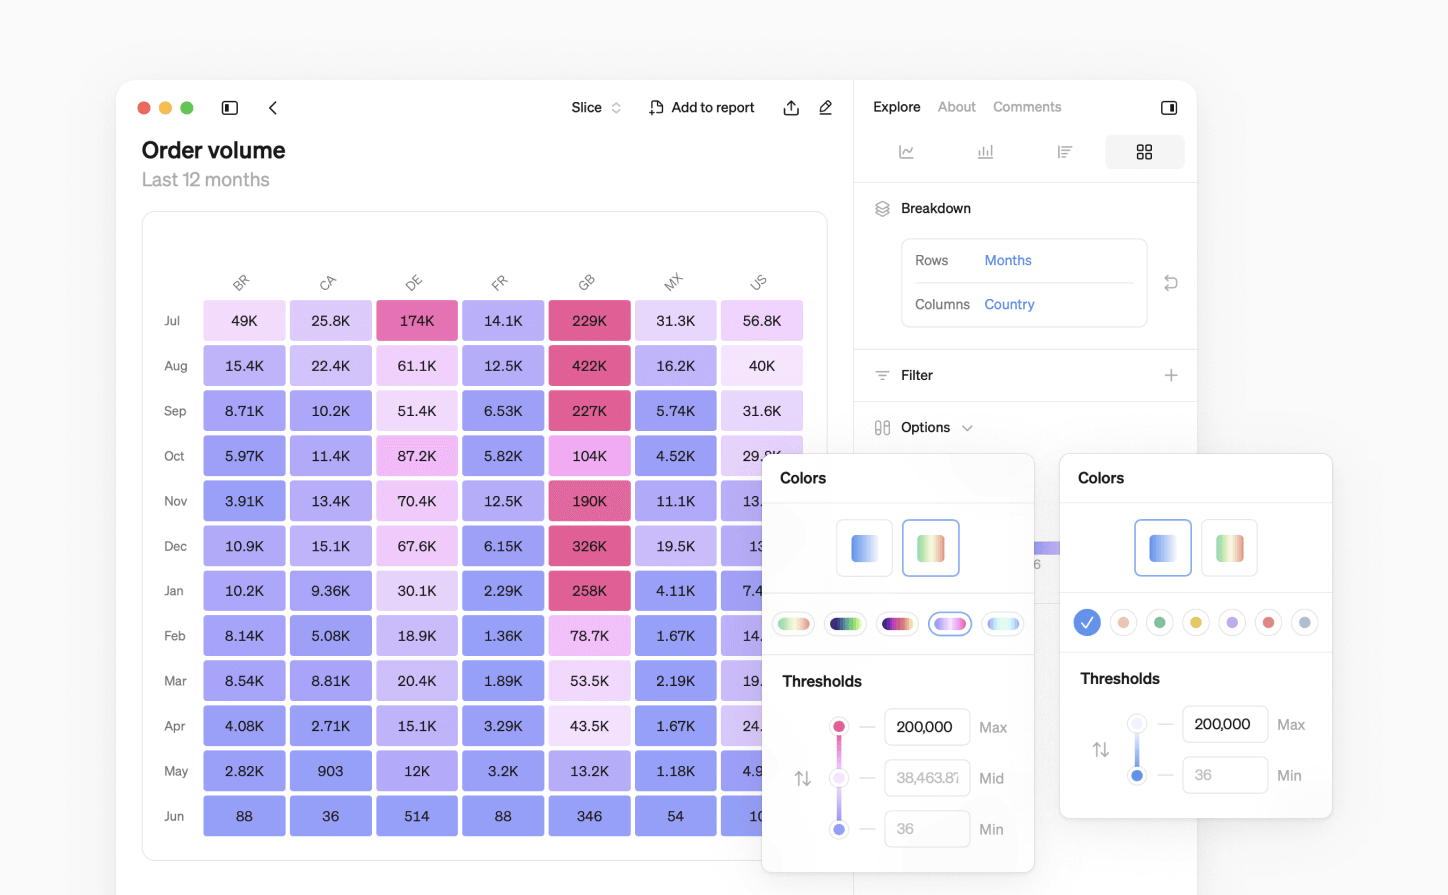
We’ve added more ways to tailor your charts and reports, adding clarity and structure to your day-to-day analysis.
New color schemes
We take great-looking visualizations seriously. We’ve added ten new monochrome and multi-color schemes to Steep, available for tailoring your pivot and cohort tables.
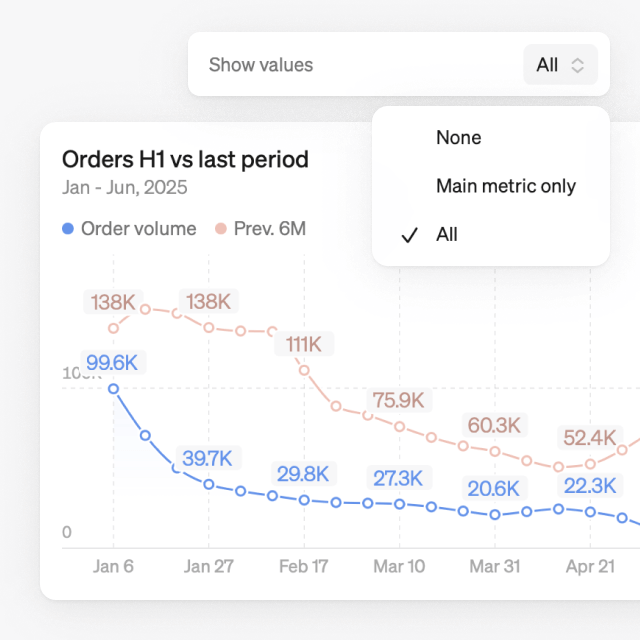
Show values clearer
We’ve optimized how chart values are displayed to keep them easy to read, regardless of data density.
- Show values for just the main metric, making it easier to spot key changes without overwhelming the chart.
- Values align with x-axis dates and adapt to chart size, always showing the last value.
- Hover over any item in the legend to highlight the values in the chart.
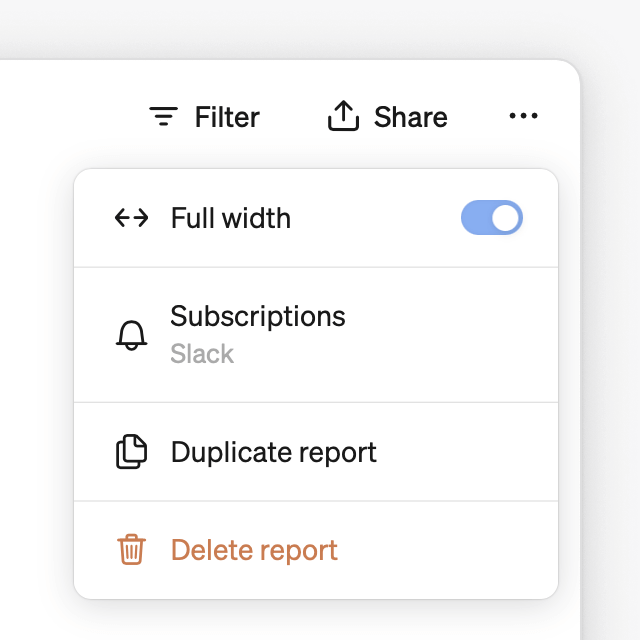
Full-width reports
All reports can now be expanded to full screen width, allowing you to utilize your whole screen to display your visualizations. This gives you a clearer overview of your key figures and more space to compare your metrics. Simply toggle on for a full-width view.
This month's updates bump up table features and customization options, with new color schemes, full-width reports, and clearer value displays. These improvements give you more intuitive ways to explore and present your data in Steep.
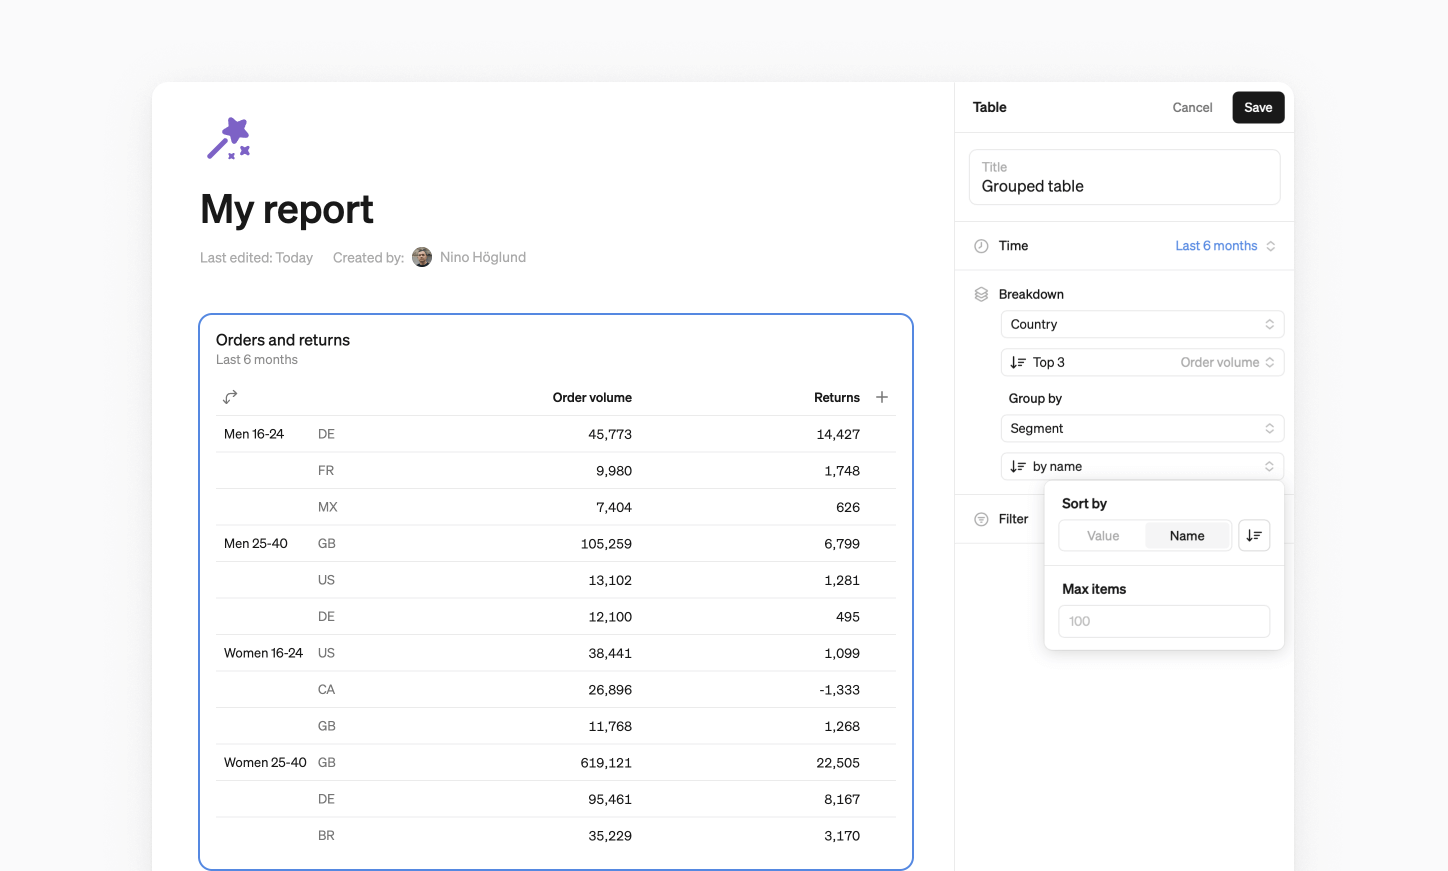
Tables, leveled up
We’ve improved table functionalities, making them more intuitive and giving you better ways to arrive at your insights.
- Sort by dimension values alphabetically or by value to highlight your top (or bottom) performers.
- Group by dimensions. Add a second dimension or time variable to your table breakdowns. This lets you compare segments side by side, or track changes over time in a single view.
- Export to CSV for easy sharing, documentation, or offline work.
More this month: Fuzzy search
The search function has been upgraded, and now supports fuzzy search. It enables you to find reports, metrics, teams, pages, or settings without having to match the exact name when you’re typing in the search field.