May 16, 2024
Streamline your workflow
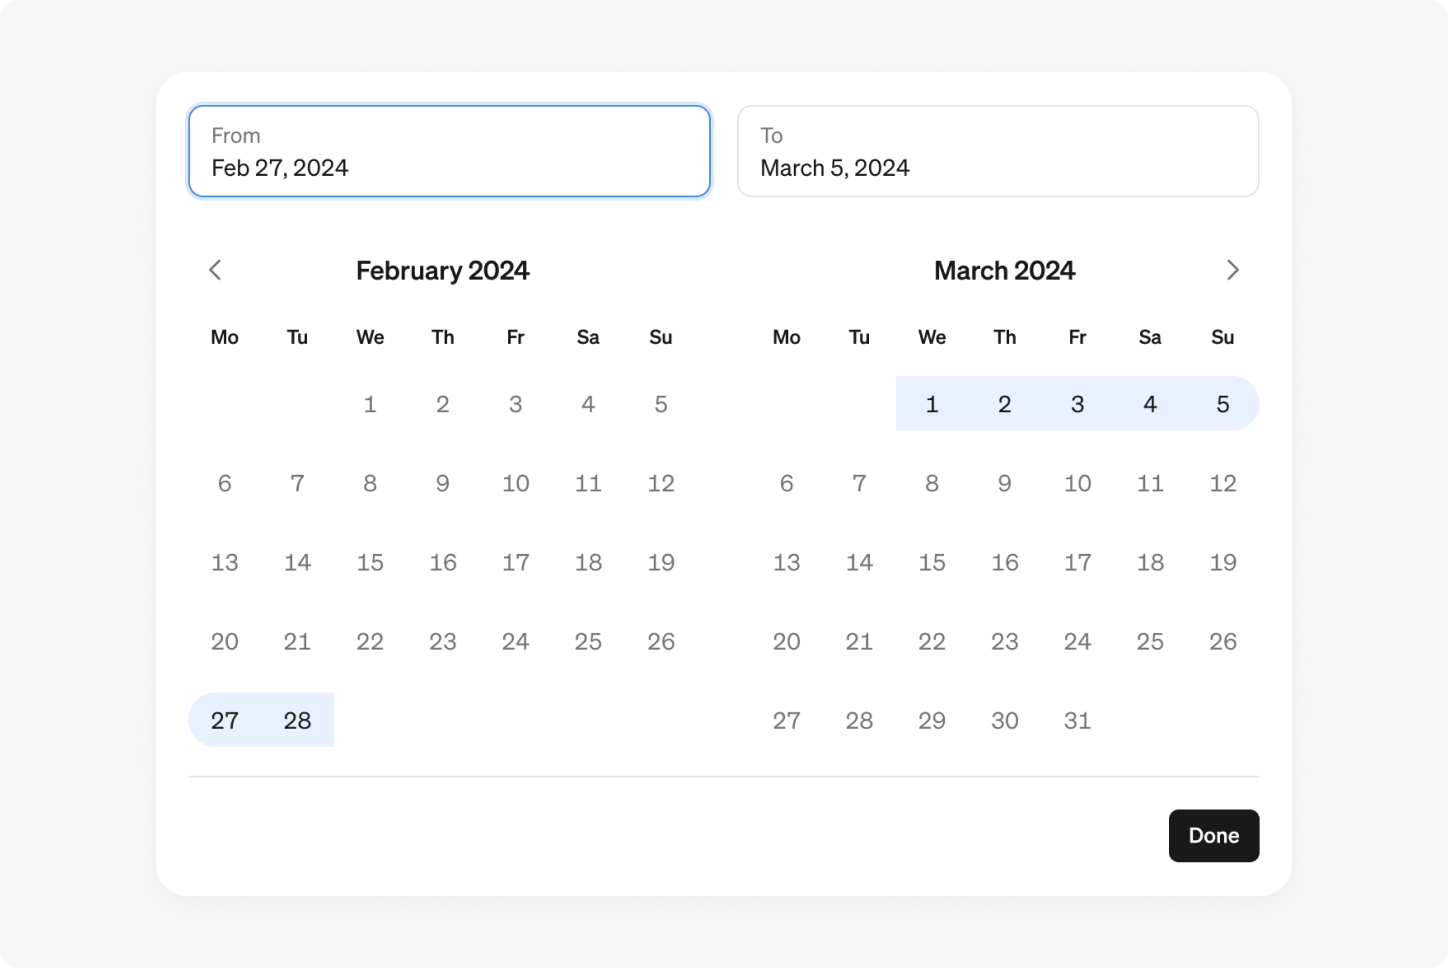
Custom date ranges
Now, you can select a custom date range when exploring metrics and reports. Custom date ranges are available the explore view, filters, tables and report filters. Whenever you select a time range in Steep, you now have the option to set any start and end date.
Copy data
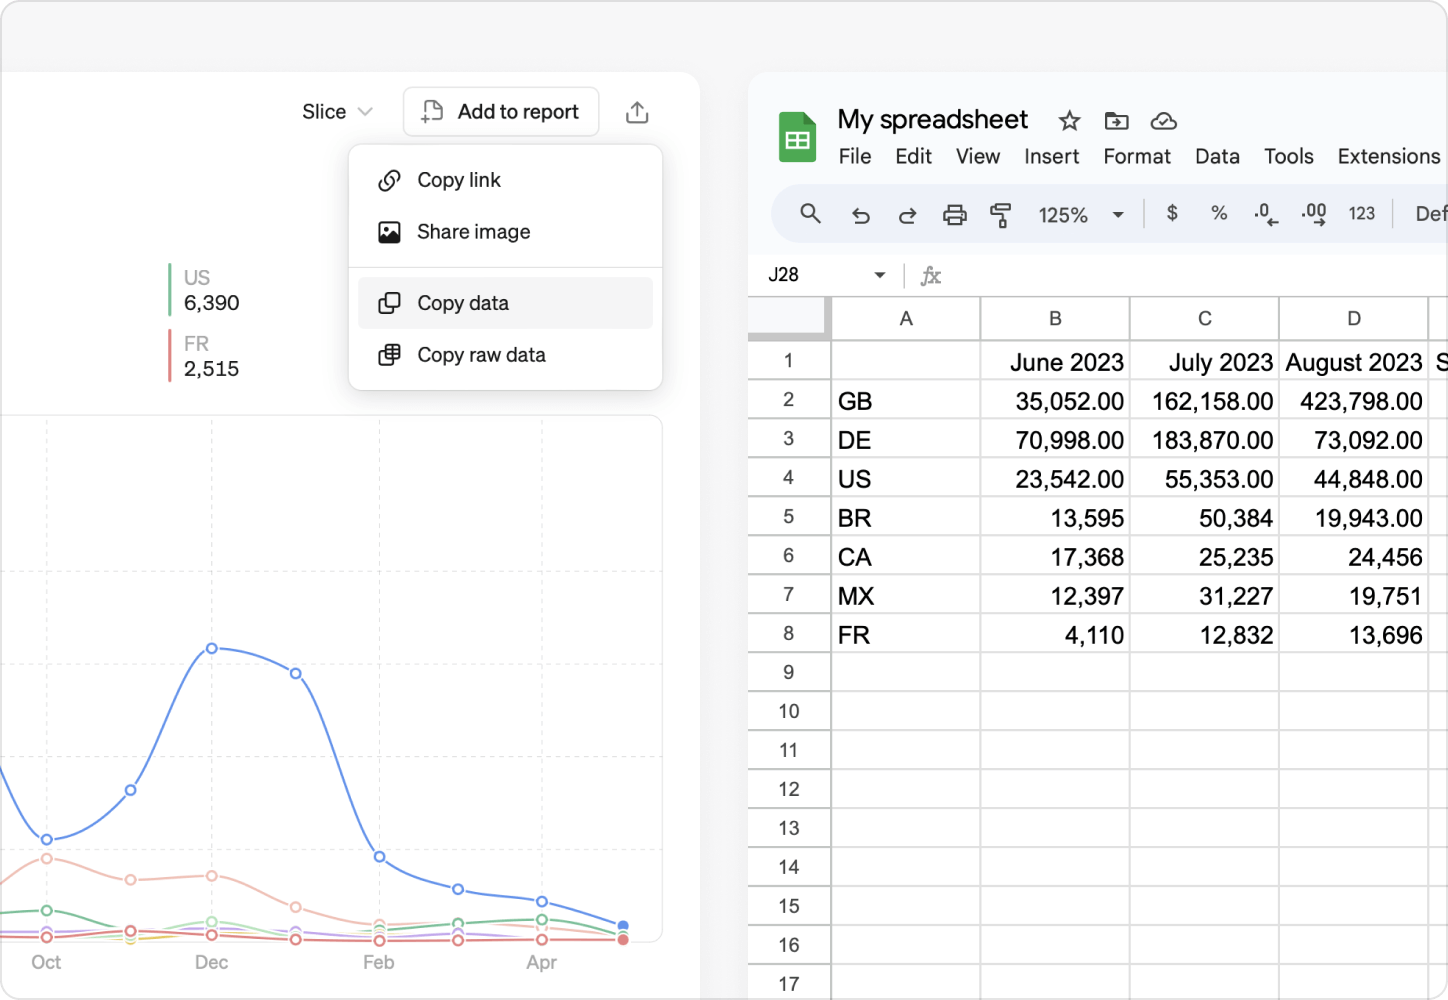
Copying data is now easier than ever, allowing you to seamlessly copy data to external tools like Google Sheets or Excel. You can copy data for any metric in the share menu, chart block, or table in a report. All comparisons, targets, and breakdowns are included.
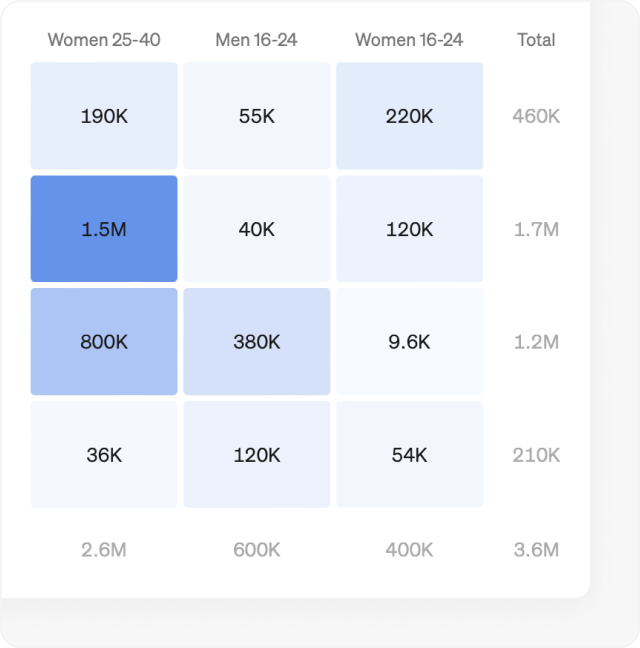
Pivot table totals
You can now display totals for columns, rows, or both, giving you a quick overview of overall performance and trends. You can enable it in the Options section.
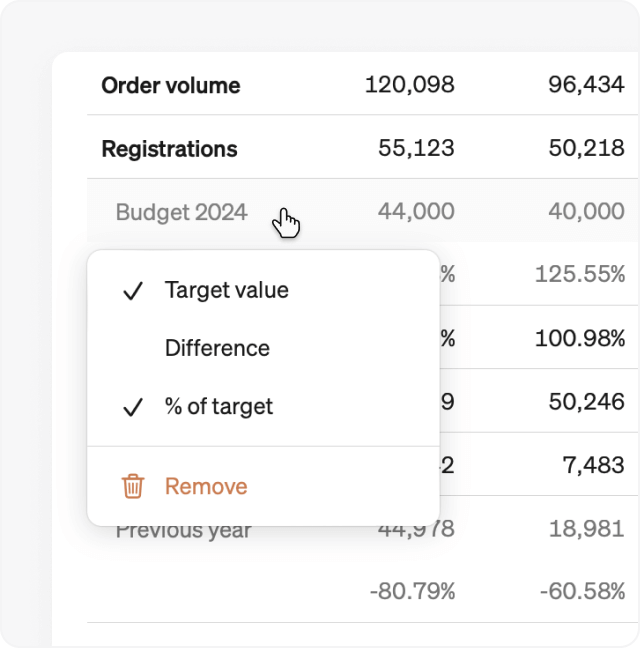
Table comparison rows
Our new table comparison rows let you add the absolute difference and percentage change of a metric compared to previous periods or targets. Add a comparison or target to a table and click it to find the new options.
Table filters
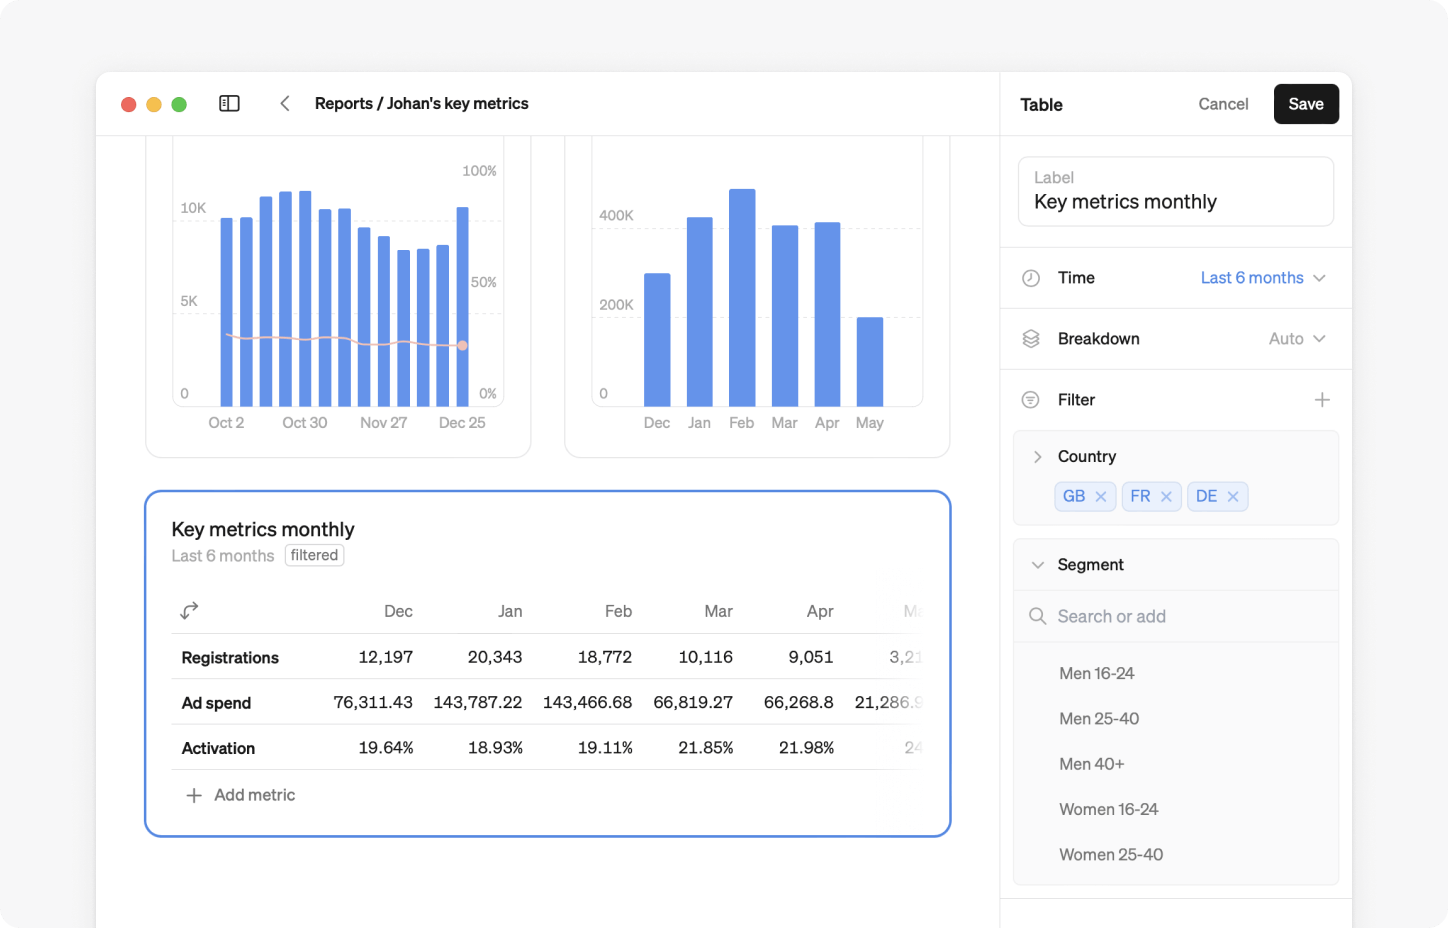
You can now add individual filters directly to any table in reports. Simply click the edit icon in the top right-hand corner of your table. Then, under the filter drop-down menu, select the dimensions you want to use.
100% stacked bars
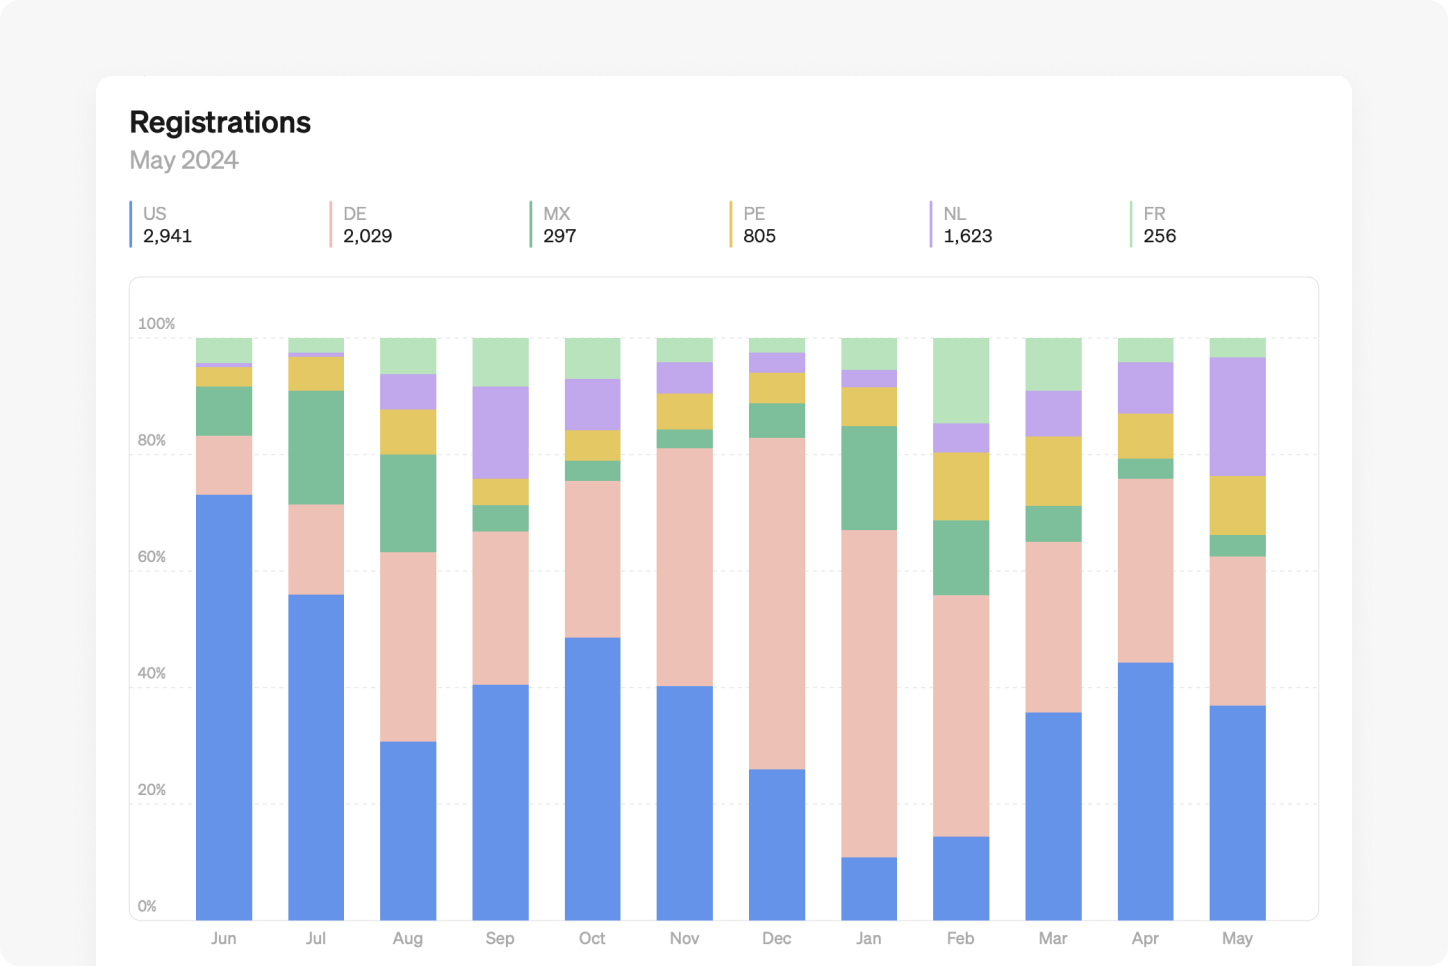
Introducing 100% stacked bar charts, a powerful update to our bar chart visualization. These charts are particularly useful when you want to understand how each dimension of a metric contributes to the whole over time. Find it in the Breakdown section of any bar chart.
Product overview
Looking for a quick and easy way to learn about Steep? Our new product overview video has everything you need to get started.