July 8, 2024
AI Chart Builder
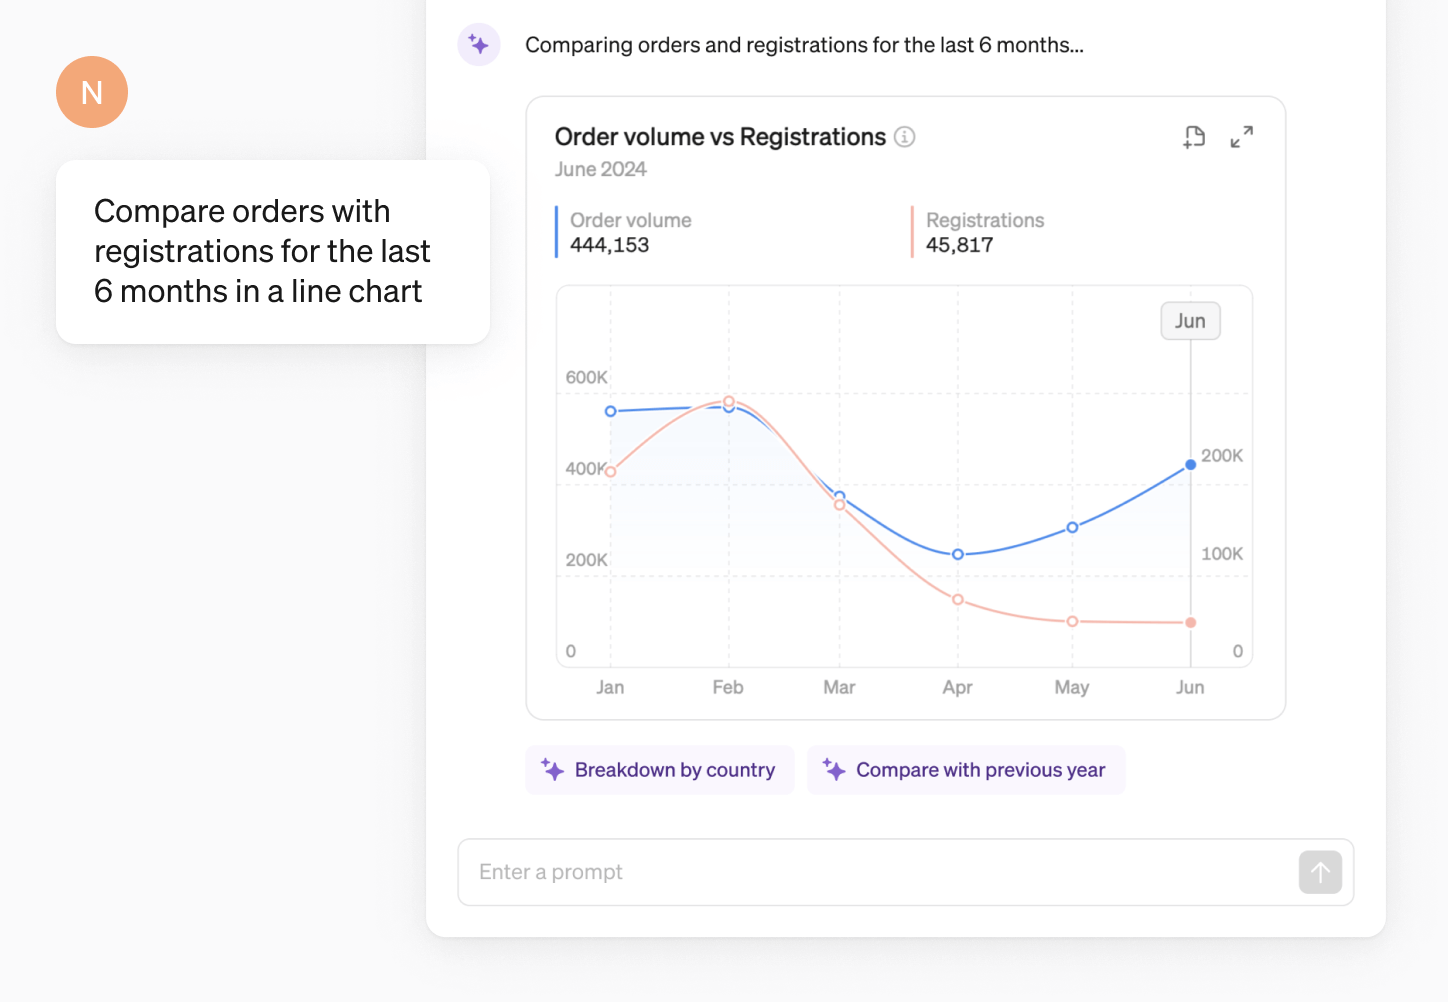
Talk to your data
Simply ask Steep AI what you’re looking for, and it will generate a relevant chart from your metrics catalog. The charts can then be explored, shared, or saved to a report.
The chart builder supports:
- Creating charts of any metric in your catalog
- Various chart types (rank, line and bar)
- Relevant time periods and time grains
- Comparing with other metrics, time periods or targets
- Detailed breakdowns by dimension
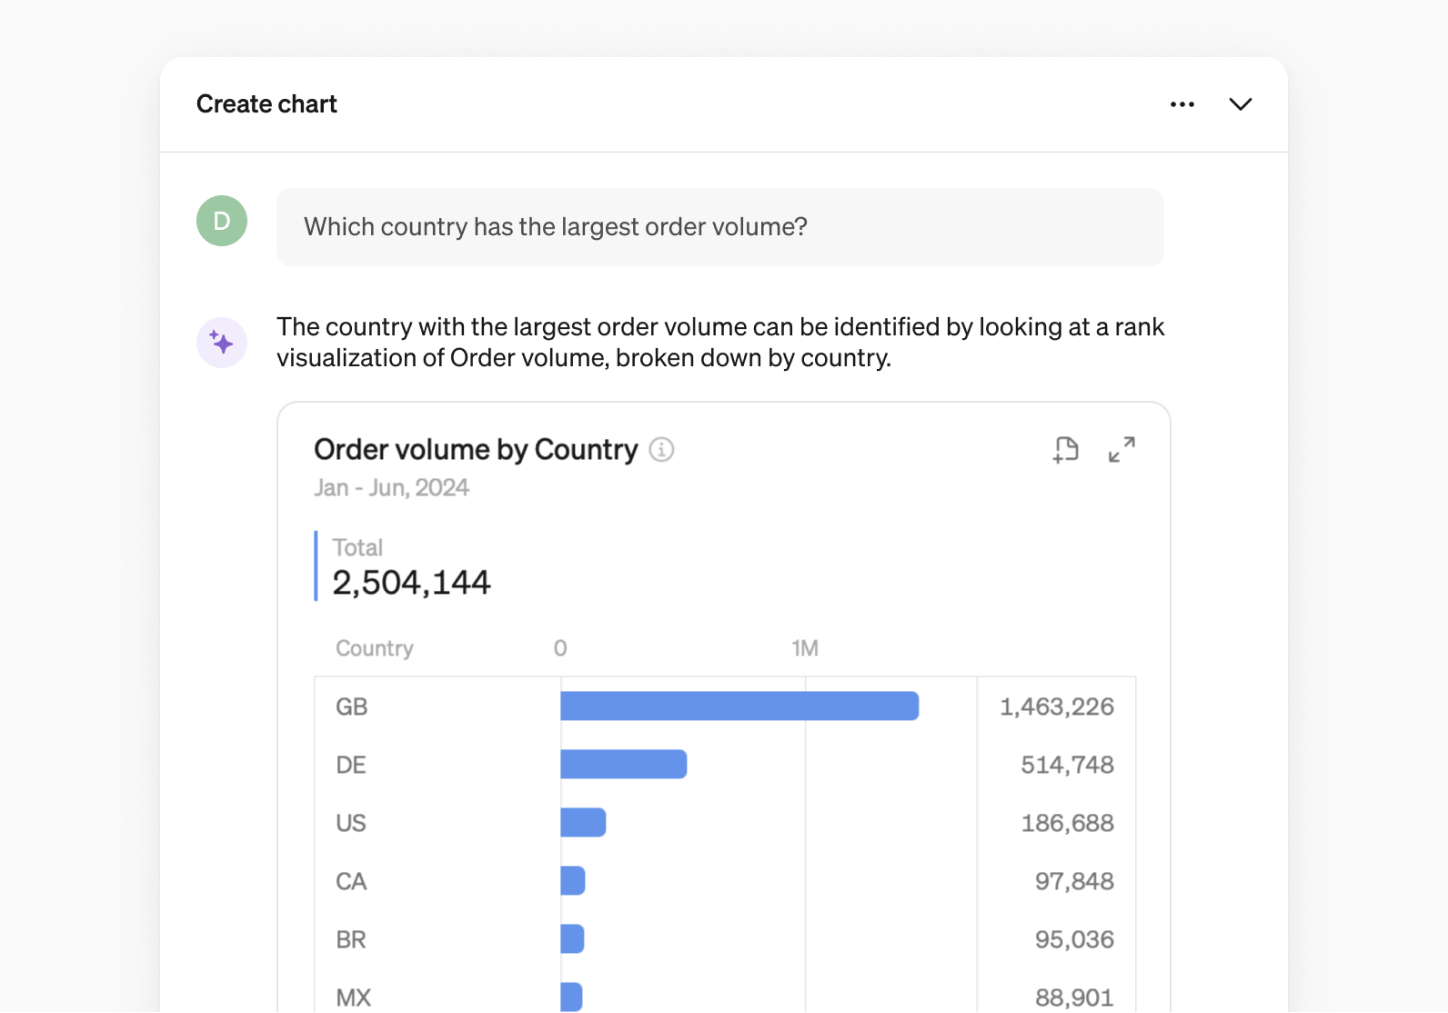
How it works
Steep AI uses the the metadata from the semantic layer to determine which chart to generate. No data from your data warehouse is exposed to Steep AI.
Answers you can trust
Since all charts are built from your metrics catalog, you can always trust the charts Steep AI generates.
Available everywhere
You can use the Steep AI chart builder everywhere in the Steep app. Just click the Steep AI button in the bottom right corner and start typing.
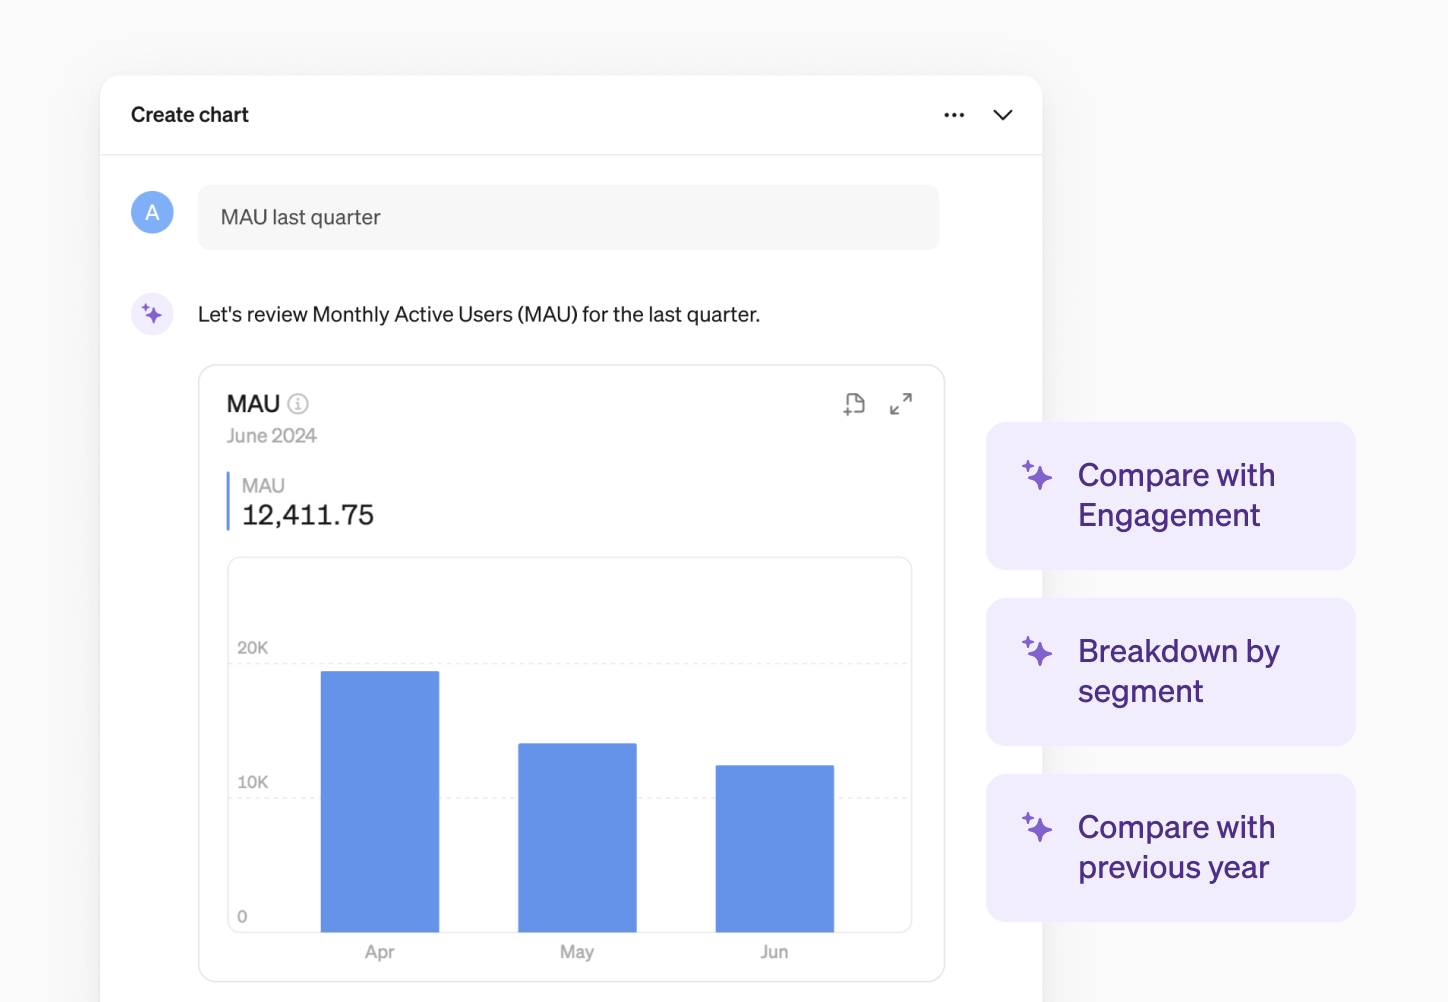
Context-aware
Steep AI is context-aware, so you can ask follow-up questions to refine the chart, to get exactly what you are looking for, and to keep digging deeper.
Suggested prompts
Sometimes, getting started is the hardest part. That’s where suggested prompts come in handy. Just click on a suggested prompt and Steep AI will generate the chart in seconds.
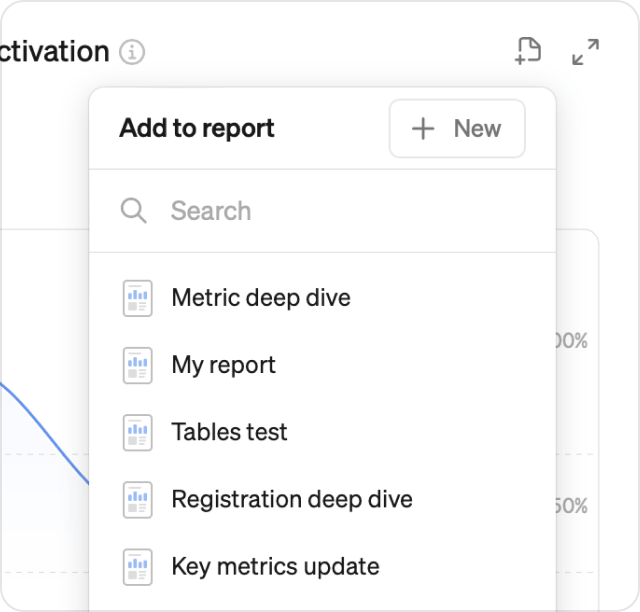
Using your charts
Any chart you generate can be saved to a report or explored further.
- Add charts to a new or existing report directly from the chat box.
- The explore button takes you to the metric screen and includes all parameters